

Updated October 20, 2025
It was a busy spring and summer this year working on projects and only had time to intermittently post precious metal & current event updates on X. Since my most recent analyses (mirrored at SubStack) published for silver on July 15 ( thread), and gold on July 22 (X thread), the price action in constitutional sound money are having a tremendous rally to all-time highs (ATH). As I pound away at the keyboard early this morning, gold’s renewed secular bull run has continued to roar after decisively leaving the 2020-2024 $2,075 per ounce ATH in the dust back in March 2024 (chart) following an Inverse Head & Shoulders consolidation pattern, and silver is only $1 away from challenging its infamous 2011 high around the $50 zone.
For those who followed my analyses and were astute with stacking physical and/or trading paper positions, you’ve doubled brokerage balances, savings accounts, or retirement funds with gold since at least mid-winter 2024 and a majority of silver’s gain since late June 2025. A sincere congratulations to all, especially for peeps that follow my Fusion Analysis work, put in precious time and genuine effort to learn basic technical analysis charting principles, then apply that knowledge to investing and “plan your trade and trade your plan.”
My story folders are extraordinarily stuffed with data and news since my previous articles published in July. Let’s move on to a link garden with only a few select commentaries and news items from shortly before and then after Jay Powell’s speech in August at Jackson Hole, a technical analysis on gold and silver spot charts, and end with an interview by Daniela Cambone with Dr. Nomi Prins on China’s recent gold hoarding strategy. And lastly, a heartbreaking video clip of a father mourning the murder of his daughter at a House Judiciary Committee field hearing in NC. Citizens and/or illegal aliens who are violent criminals and repeat offenders are roaming the streets due to the woke leftist no-bail policies and is juxtaposed against extreme levels of politically driven civil unrest in sanctuary cities & states.
- Why I invested nearly one billion in precious metals past 6 months – David Bateman
- Metal Wars: Silver Becomes US Strategic Metal as Premiums Explode – Scottsdale Mint
- FOMC Fed Rate Cut – All About Jobs – Armstrong Economics
- Conditions ‘may warrant’ interest rate cuts as Fed proceeds ‘carefully’ – CNBC
- Fed’s Kashkari advocates two more rate cuts this year, tariff impact on inflation – CNBC
- Central Banks Make History: Gold Holdings Eclipse Treasuries, 1rst Since 1996 – USA Gold
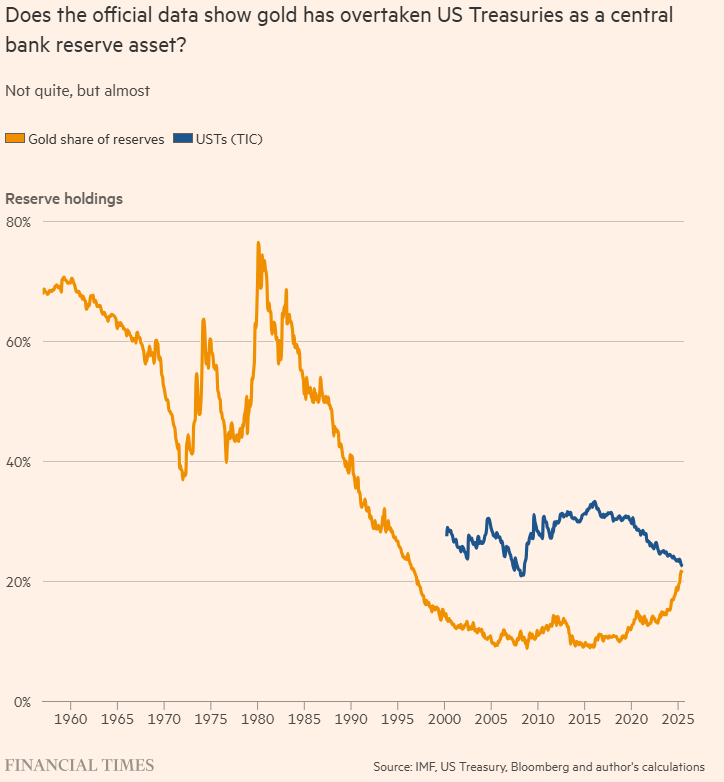
“A 60/20/20 portfolio strategy that includes 20% gold is a more resilient inflation hedge at a time when U.S. equities are offering historically low upside over Treasuries and investors are demanding higher yields for long-term bonds, Morgan Stanley Chief Investment Officer Mike Wilson said on Tuesday. A 60/40 portfolio, which typically has 60% of its holdings in stocks and the remaining 40% in fixed income, counts on moves in the two asset classes to offset one another, with stocks strengthening amid economic optimism and bonds rising during turbulent times. Wilson, however, favors a 60% allocation to equities and 20% each to fixed income and gold . Within bond markets, the prominent Wall Street bear prefers shorter-duration Treasuries of five years over the 10-year notes to capture rolling returns along the yield curve. ‘Gold is now the anti-fragile asset to own, rather than Treasuries. High-quality equities and gold are the best hedges,’ Wilson told the Reuters Global Markets Forum.” – Reuters Sep. 16
- Treasury Secretary Bessent: Most jobs created under Biden went to illegal aliens – The Hill
- China Courts Foreign Gold Reserves to Boost Global Clout – Bloomberg
- Slowdown Signals: Are Fed’s Favorite Leading Economic Indicators Flashing Red? – RIA
- AI Superintelligence is Beyond Reach – Jim Rickards
- Bubble in AI? – RIA
- Prelude To A Second Civil War? – Portfolio Armor
- India’s September gold, silver imports nearly double despite record prices – Reuters
- Citigroup forecasts Big Tech’s AI spending to cross $2.8 trillion by 2029 – Reuters
- Consumer confidence lower than expected, Wall Street braces for gov shutdown – CNBC
- ADP Employment Report: -32,000 Jobs after -43,000 Annual Adjustment – Wolf Street
- Jobs Report shows hiring at lowest since 2009 – CNBC
- Russian Attack Targets Military-Industrial Sites In Western Ukraine, Near Poland – ZH
- Kremlin: West’s drone accusations baseless – RT
- US House Speaker Johnson: Simple truth why the government shut down – Live Presser
- Trump to Newsmax: Democrats Out of Control on Shutdown – Newsmax
- Goldman hikes December 2026 gold price forecast to $4,900/oz – The Straits Times
Gold’s on the verge of reaching $4,000. What’s behind its seemingly unstoppable rally… “The rally for the precious metal has been fueled by five ‘strong tailwinds,’ said Koos. Those are ‘sticky inflation, geopolitical (add US domestic unrest) tension, a weaker dollar, central-bank demand, and investors hedging against volatility.’ Market watchers also have noted that record government debt levels have contributed to the resilience of gold’s rally this year.” – MarketWatch, Oct. 6
Below is today’s technical analysis on gold, and silver. Rips and dips in the dollar and breaking news events combined with the dominance of algorithms, automated trading decisions, high-frequency trading (HFT) platforms, and artificial intelligence radically influence price action across all financial markets in either direction within microseconds and cause bouts of extreme volatility. Be mindful that a window of opportunity for swing or scalp trading precious metal ETFs, spot, options, futures, or mining stocks does not necessarily equate to the timing for layering core long-term positions or investing in physical bullion and coins. Slicing and dicing a daily chart provides a window into the next several days or weeks.
Properly identifying patterns on a price chart is not an art class because the timeframe and underlying technical indicators determines a pattern’s authenticity. All the tools required can be found on the right sidebar at TraderStef.com under the “technical analysis toolbox” title.
Diversification in your investment portfolio should be done by utilizing the predictive risk management skill of connecting dots through the awareness of global events, and become a competent “technician” (Jim Rickards refers to that terminology in the below video clip) by learning basic technical analysis skills are your best defense in markets (aka Fusion Analysis). The bottom line is the PRICE action, which is a convergence of numerous factors (aka Complexity Theory) before a candlestick prints into history. If you haven’t already, required viewing is HFT: Money & Speed (2011) and HFT: Wall St. Code (2013) to fully grasp the impact of AI automation on high-frequency trading (HFT) platforms that Rickards succinctly explained.
Complexity Theory as applied to “95% of trading on the NYSE is completely automated” – Jim Rickards, Aug. 2025
AI Is Powering Markets – “On May 6, 2010, the US stock markets dropped nearly 10% within minutes. What would be called a ‘flash crash’ wasn’t caused by news, economic data, or a Fed policy decision. According to the U.S. Commodity Futures Trading Commission (CFTC), a large sell order on E-Mini S&P 500 futures, executed by a mutual fund and triggered by an algorithm, was the culprit. Furthermore, the sell order triggered other high-frequency trading (HFT) algorithms to follow suit and sell. Before the 2010 Flash Crash, algorithmic trading was limited. Since then, it has become the dominant form of trading. More recently, the rise of AI has become a key element in powering trading market algorithms. As a result, AI is powering markets.” – Michael Lebowitz, Jul. 23, 2025
To view a larger version of any chart below, mouse over it and select or right-click and choose a “view image” option.
Gold Spot daily candlestick chart as of Oct. 6, 2025 at 5pm ET close…
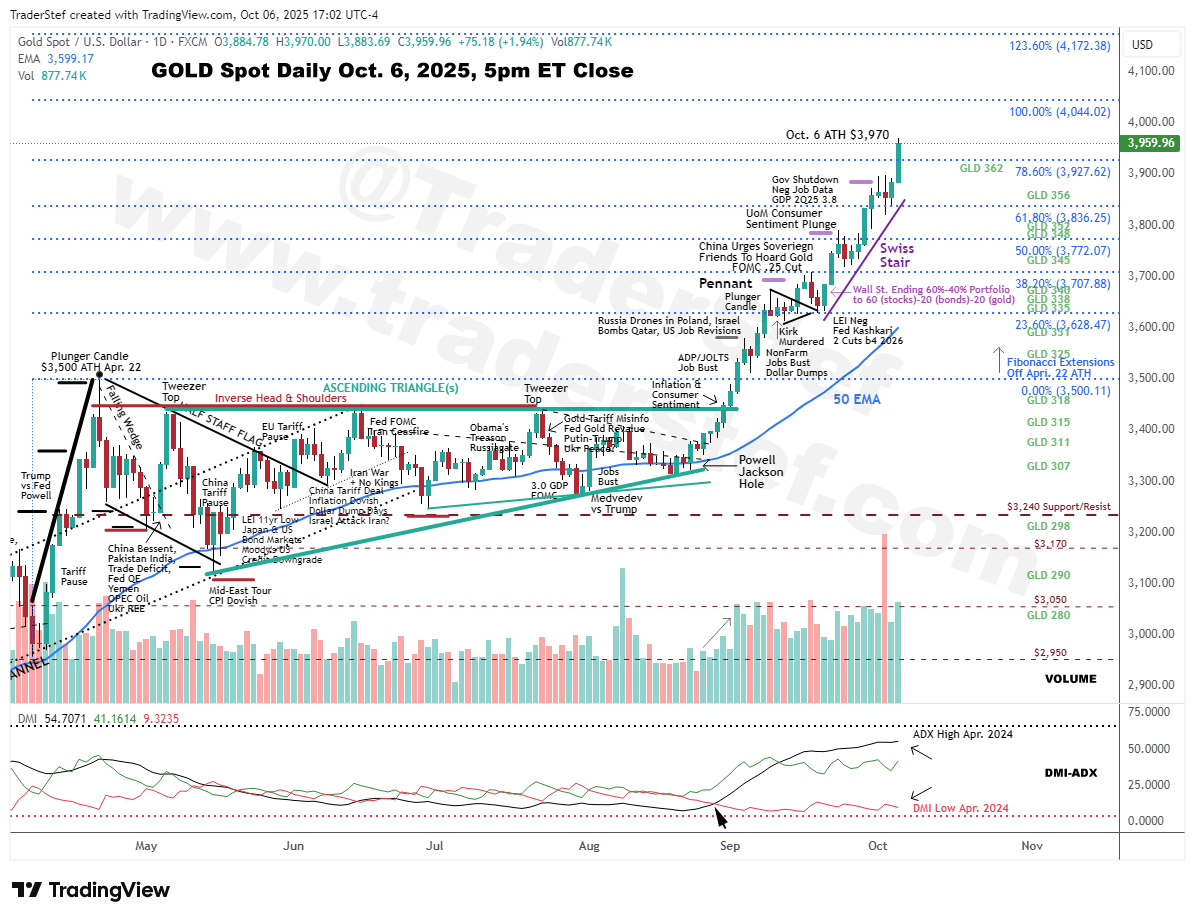
Excerpt from the Jul. 22, 2025 (thread) daily chart analysis:
“Gold Spot is today’s focus with an Inverse Head & Shoulders right-shoulder that rallied to $3,433 and is just shy of Neckline resistance above $3,450 and below the $3,500 ATH. The seasonal consolidation process began with a Half Staff Flag followed by news driven rallies, which morphed into an Inverse Head & Shoulders pattern nested with a Cup & Handle. If the Neckline is not decisively breached and more consolidation takes place, we may have an Ascending Triangle on the table. Either option is bullish and higher price points are likely into August as India’s fall wedding season increases demand for gold and silver. If a powerful rally develops, the next price levels to watch are Fibonacci Extensions in blue sky territory around $3,630, $3,710, $3,775, and $3,836. Support levels for any pullback are annotated. Stay frosty if trading paper, and keep those bullion coins safe.“
All variables noted in July have come to fruition and resulted in an explosive rally that closed at $3,970 per ounce today. Well above $4,000 is entirely possible, but be aware that a breather and consolidation is preferred before the price action gets out of hand resulting in an unruly spike followed by a sudden collapse. Steady Eddie is much better for building solid support levels and especially in new blue sky territory. As I type this section, gold spot reopened at 6pm ET on GLOBEX and is trading at $3,976.
A Swiss Stair pattern developed off a Loose Pennant base since Sep. 11, and is indicative of institutional accumulation after the Fed’s Kashkari called for two more interest rate cuts by the New Year, and Morgan Stanley’s recommendation to shift from the classic 60/40 investment portfolio to a 60/20/20 strategy with 20% in gold. It is highly unusual for a Swiss Stair to appear at the heights of a vertical rally vs. a bottoming where smart money typically buys into lows, so be aware that substantial paper-profit taking may happen at any time. A solid support level where several days of price chop occurred needs to be solidified following the decisive launch out of an Ascending Triangle consolidation (with a nested Inverse Head & Shoulders ) since the first week of September.
The DMI-ADX is approaching overbought territory, but Alligator Tongue setups in a power trend rally can remain elevated for an extended period or just lose momentum and return to a positive stance after a breather. The 50 Exponential Moving Average (EMA) is uncomfortably too far south from the price, as that line acts like a magnet which is eventually revisited in a robust pullback or an extended consolidation. Volume continues to be healthy with a buyside majority. The next Fibonacci Extension levels are at $4,044, $4,172, $4,252, and $4,380. Support levels are at $3,835, $3,770, $3,705, and $3,628. The chart remains bullish, but caution is warranted in the near term.
Silver Spot daily candlestick chart as of Oct. 6, 2025 at 5pm ET close…
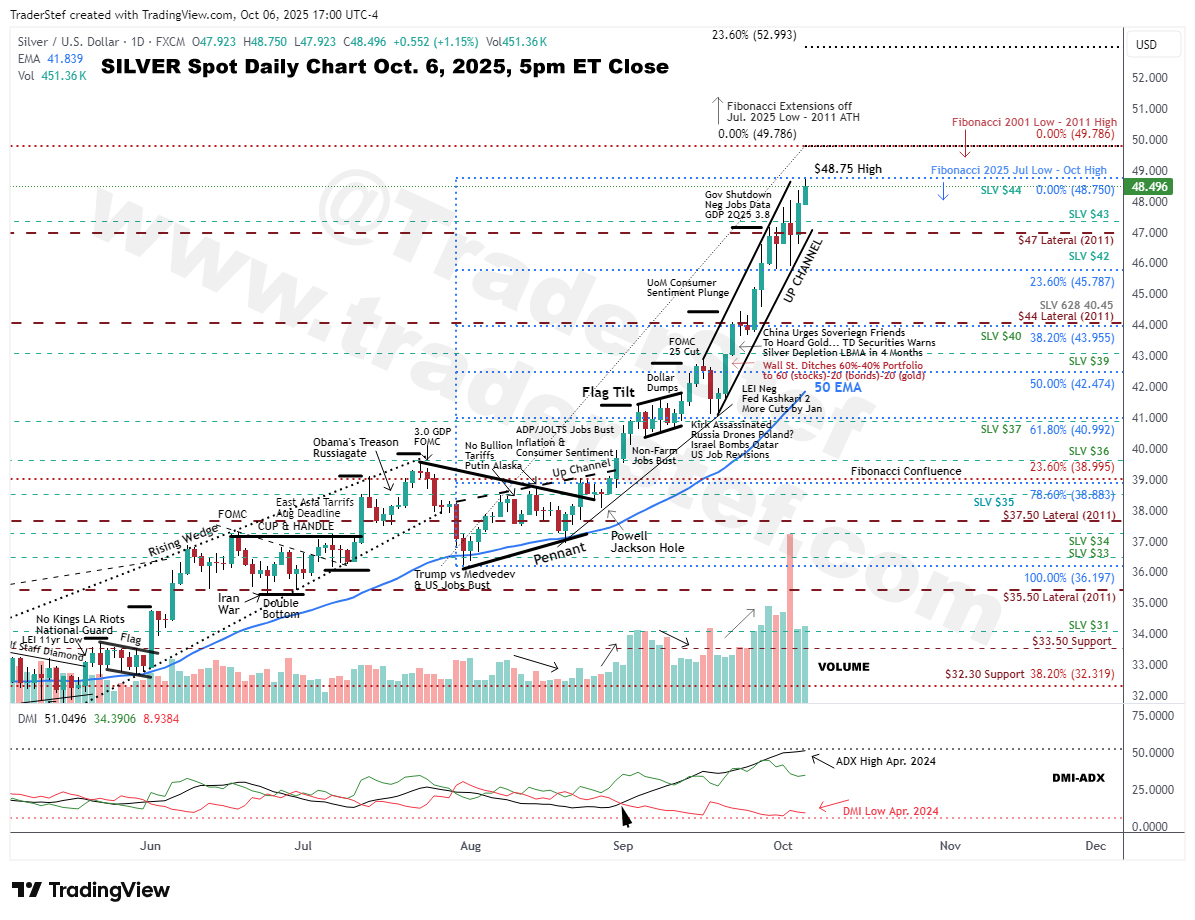
Excerpt from the Jul. 15, 2025 (thread) daily chart analysis:
“In the late spring update published on April 30, I noted that gold and silver would likely chop into a consolidation that mirrors seasonality price action before a potential summer rally… Silver’s rally since August is reminiscent of the late April of 2011 ATH to $49.79 before gold printed an ATH in Sep. 2011. The price action in silver tapped $38.52 on Friday Jul. 11 after ripping through the $37.25 rim of a Cup & Handle pattern to a high of $39.12, which nested an Adam & Adam Double Bottom test of support at a $35.50 lateral drawn back to 2012. Profit taking on Monday Jul. 14 closed with a bearish Plunger Candle (aka Shooting Star) that closed at $38.09, so expect a breather to establish fresh resistance and support levels before challenging $44 and $50. That move could happen sooner than later.”
This is NOT 1980 or 2011 as the world IS very different on too many issues to mention. The price of silver is only $1 away from challenging the 2011 high of $49.79, so we’ll see what happens as the price action approaches that level. Silver printed a high today at $48.75, following a renewed rally that began in late August with a breakout from a Loose Pennant consolidation, then a Flag Tilt through mid-September, and a near-vertical Up Channel launched after the Fed’s Kashkari called for two more interest rate cuts by the New Year and Morgan Stanley shifted to a 60/20/20 portfolio recommendation. The next level to watch is the how the price action plays out when the 2011 high is challenged. If the rally continues, the next four Fibonacci Extension levels are $52.99, $54.97, $56,58, and $58.18. Support levels are at $47, $45.79, $44, and $42.40.
The supply of silver is drying up (noted in BNN Bloomberg report below) fast as institutional vaults in London and elsewhere are being emptied in the midst of a multi-year supply deficit. It seems that severe silver & gold shortages are brewing. Technical indicators on the silver chart are nearly identical to gold’s, therefore the chart remains bullish and caution is warranted in the near term.
The following quote is from Bloomberg on Oct. 18. I’ve emphasized since spring and within analyses during previous years of how seasonality factors impact the demand & pricing of gold and silver, especially during India’s biannual wedding season:
“Sold Out in India, Panic in London: How the Silver Market Broke – Bloomberg, Oct. 18
- India’s largest precious metals refinery, ran out of silver stock for the first time in its history due to high demand from Indian customers.
- The shortages in India were soon felt globally, with the London silver market also running out of available metal, and traders describing a market that was ‘all but broken’.
- The silver market crisis was caused by a combination of factors, including a multi-year solar power boom, a rush to ship metal to the US to beat possible tariffs, and a sudden spike in demand from India, particularly during the Diwali holiday season.”
What is driving the gold rally, and a silver supply crunch – Daniel Ghali, director and commodity strategy at TD Securities on BNN Bloomberg, Sep. 22
China Plans 4 New Gold Hubs as it Moves Forward w/Global Reset – Daniela Cambone interview with Dr. Nomi Prins, former Goldman Sachs managing director – ITM Trading Inc., Oct. 3
Father Of Murder Victim Lets Loose On Soft-On-Crime Policies At NC House Hearing – Forbes, Sep. 29
Plan Your Trade, Trade Your Plan
Headline Collage Art by TraderStef – Screenshot From “Margin Call” Movie

Not a Financial Advisor: None of the content produced by TraderStef™, staff members, or any services associated with this website should be construed as financial or investment advice. Financial investment is a risky endeavor and may lead to substantial loss. Always perform due diligence before undertaking any financial decision – Copyrighted Material: A “by TraderStef” credit linked back to this website is required when using any quotes, technical analysis charts, or publishing a partial version of an article.


You must be logged in to post a comment.