

As of January 2026, the workshop is no longer available. Rare exceptions will be made.
“Opportunity is missed by most people because it is dressed in overalls and looks like work.”
— Thomas Edison

This workshop is focused on technical analysis of a price chart which is integral to Fusion Analysis and requires more than a one-session commitment. Learning how to manually read a stock chart takes precious time with a cohesive timetable to study basic principles, process, and a broad range of candlestick pattern and indicator combinations. Everyone proceeds at their own pace. The skill-set applies to all asset classes. The high liquidity in gold and silver spot are ideal charts to slice and dice for finding realistic and reasonable analysis focused on profit and capital preservation based on market conditions and price action with proven methods to execute low-risk entries. Avoid pitfalls of naïve trading, passive investing, automation, and poor risk management that result in major setbacks.
Each session is limited to one or two participants. Beginners and intermediate level students attend different workshop days. This opportunity is not for you if prefer an automated-algorithmic system or duplicate trades by someone else. You will be taught how to fish. Everyone has time during each session to analyze stock charts of their choice. If your intention is only to request a chart analysis without commitment to learning technical analysis, just say so in your initial contact and a brief 4-hour session can be arranged.
- Here’s Why Some Investors Buy High and Sell Low – U.S. News
- I Lost $400k, Almost Everything I Had, on a Single Robinhood Bet – Vice
- The Retreat of the Amateur Investors – Wall Street Journal
“…The average man doesn’t wish to be told that it is a bull or a bear market. What he desires is to be told specifically which particular stock to buy or sell (and when). He wants to get something for nothing. He does not wish to work. He doesn’t even wish to have to think… Patterns remind you that every movement of importance is but a repetition of similar price movements, that just as soon as you can familiarize yourself with the actions of the past, you will be able to anticipate and act correctly and profitably upon forthcoming movements… Without discipline, a clear strategy, and a concise plan, the speculator will fall into all the emotional pitfalls of the market… After a few failures and catastrophes the speculator may become demoralized, depressed, despondent, and abandon the market and the chance to make a fortune…” – Jesse Livermore
How to:
- Initial correspondence must be sent via the contact page for details, rates, and scheduling.
- Your PC set-up must include at least two 19″ monitors (or one giant screen) for ample real estate to separate the live workshop window from your desktop. A single laptop screen, tablet, or smartphone are not an option.
- Create a free TradingView.com account, activate “Paper Trading,” and familiarize yourself with its charting tools to save time getting started.
Keep it simple:
“Workshop folks had the heads up… Gold Spot vs. $USD Daily Chart – Rare & Bullish Perfect 3-Step Swiss Stair at Nov. 2022 Triple Bottom Low – Jan. 13, 2023, 1:20pm ET COMEX Close” – @TraderStef, Jan. 13, 2023

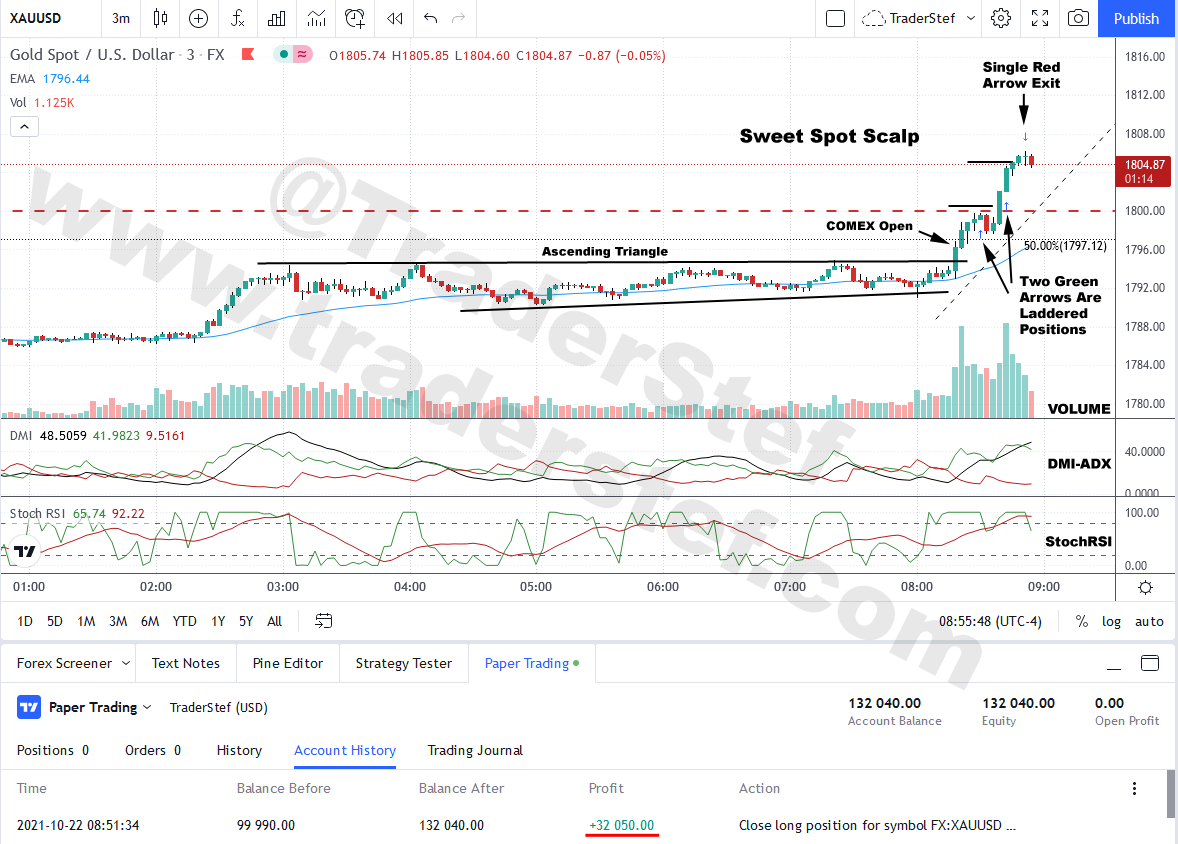
Gold Spot 3-minute chart with a 30k intraday scalp setup – Oct. 22, 2021…
Plan Your Trade, Trade Your Plan
Headline Collage Art by TraderStef – Screenshot From “Margin Call” Movie


You must be logged in to post a comment.