

Originally published on May 14, 2017 by TraderStef at CrushTheStreet
During my November 2016 interview with CrushTheStreet that immediately followed the presidential election of Donald Trump, I noted that markets would be volatile. The global geopolitical situation has ratcheted up with Syria and North Korea, most U.S. economic data is bad if not already rolling over, and domestic policy and debt left on the table by the Obama administration has market makers like Goldman Sachs wondering what’s next.
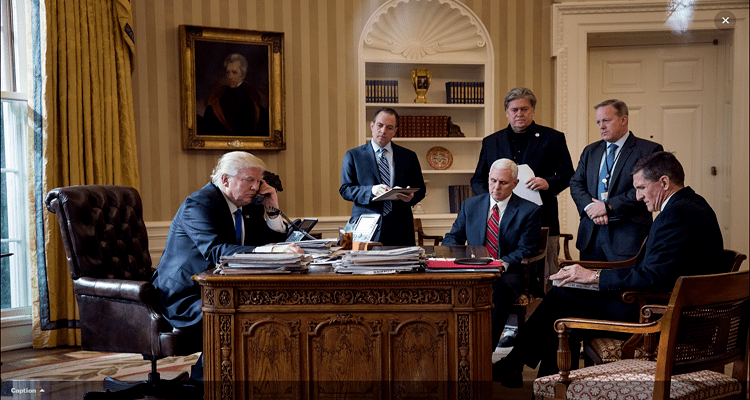
Despite all the noise, the VIX index has continued a downward trend and is sitting near a historical low. There is a new flavor of volatility not seen since the days of Andrew Jackson, which is why I coined the new POTUS as Trump The Jacksonian. Note the portrait brought into the Oval Office… fugetaboutit.
Enough about the mess left to the POTUS, as that topic deserves a post and book of its own. Let’s move onto the main topic before markets open in Asia. If you are not familiar with my technical analyses, you can review 1.5 years of time-stamped charts on a Twitter thread.
As of Friday’s market close, the $1,228 gold spot price is at the same level it was during the my November interview. Its low was $1,192 in December and printed a high of $1,295 in April.
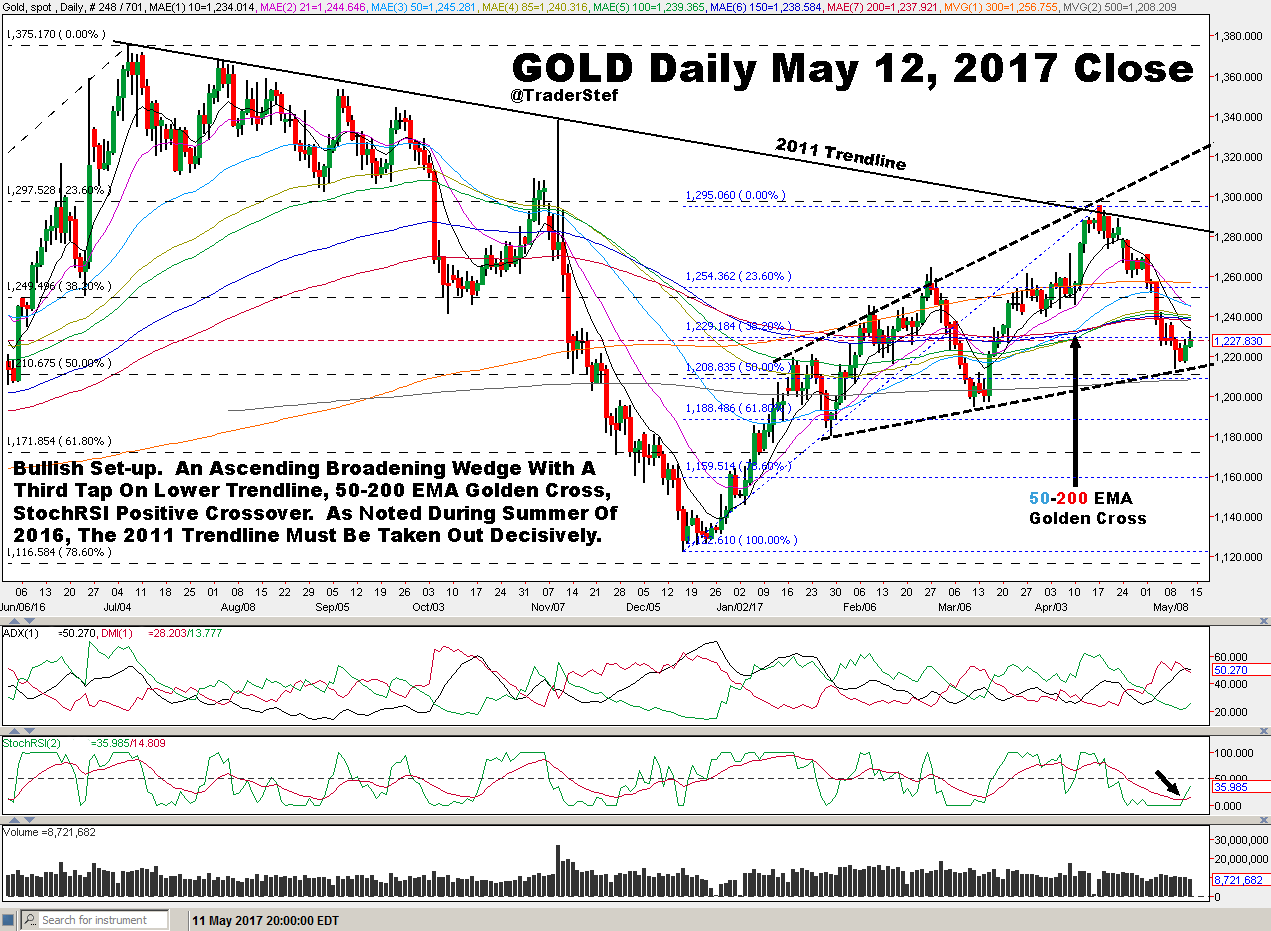
We’ve had some short term volatility and a shallow dip as expected. As per my warning during the interview, the $HUI ‘Gold Bugs Index’ was breaking down through the Neckline of a Head & Shoulders pattern, which raised the possibility of continued price weakness.
Subsequently, the price action formed an Ascending Broadening Wedge with higher highs and higher lows, and the price just tapped its lower trendline for a third time. The StochRSI has turned positive and a Golden Cross (EMA 50 & 200 Exponential Moving Average upside crossover ) took place in early April. We have the technical conditions for an upward pivot, but the rest of the world and its issues must line up with the stars for a sustained bullish move. In order for gold to continue onto the 2011 high, the topside trendline drawn down from 2011 must be taken out decisively on price and volume. The longer it takes, the lower the price point becomes on that downward trendline. Onto the silver spot chart…
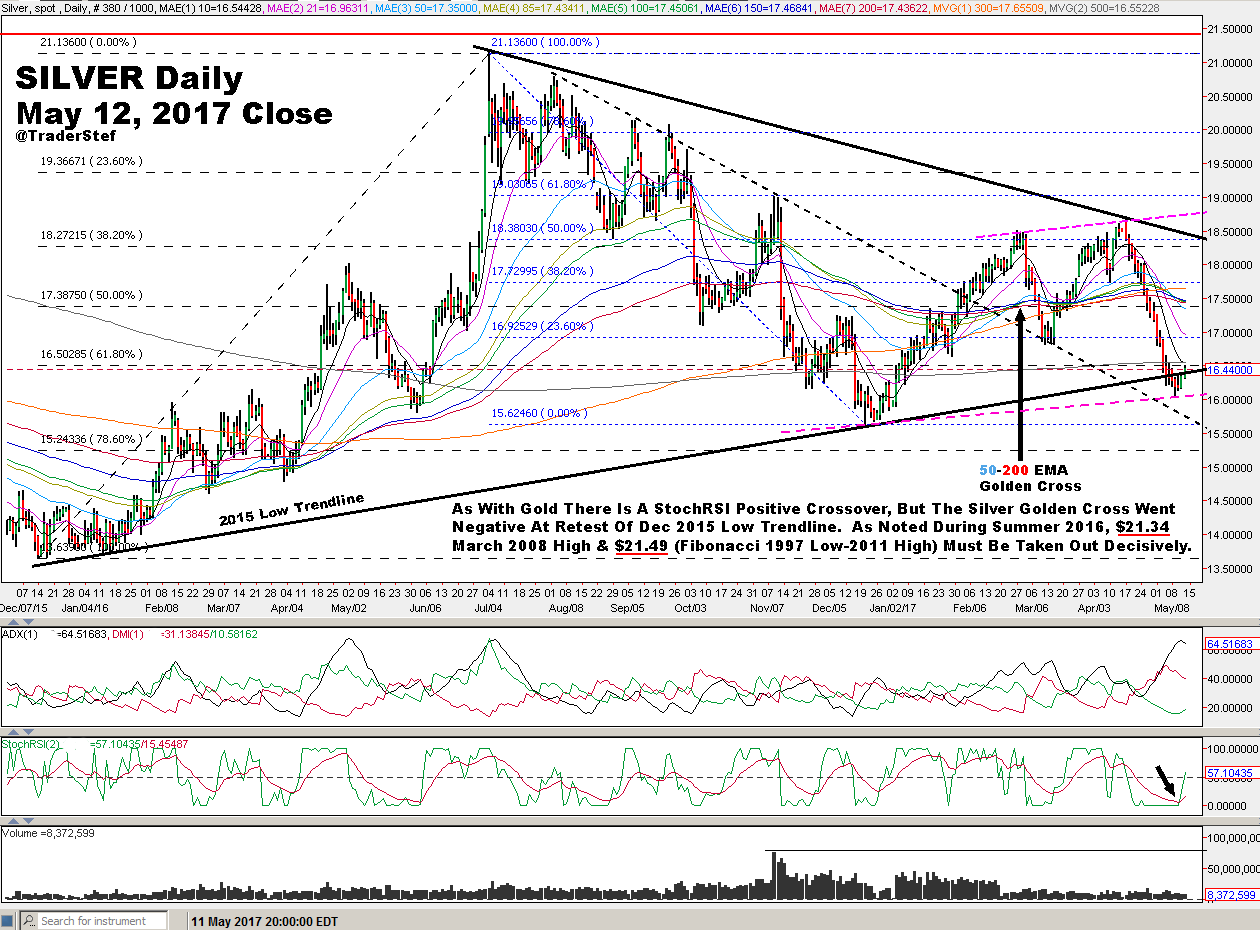
During the November interview, I discussed the Inverse Head & Shoulders neckline at roughly $16, which was taken out in April 2016 and is now acting as a support area. That price level has been tested twice since November. Going forward, silver also has support at the lower trendline drawn from the December 2015 low.
The StochRSI has turned positive which is bullish, but the Golden Cross has briefly gone negative and volume is pathetic. Silver does not appear to have the strength of gold at this time, but little brother usually catches up in the long run. For silver to run back to its 2011 high and beyond, the Mar. 2008 lateral at $21.34 and the $21.49 Fibonacci level (drawn from the 1997 low to 2011 high) must be taken out decisively on price and volume. It tapped $21.13 last July and did not have the momentum to power onward.
Plan Your Trade, Trade Your Plan
TraderStef on Twitter
Website: https://traderstef.com

NONE of the content produced by TraderStef™, staff members, or any services associated with this website should be construed as financial or investment advice. Financial investment is a risky endeavor and may lead to substantial loss. Always perform due diligence before undertaking any financial decision. Not a Financial Advisor.
Copyrighted Material – A “by TraderStef” credit linked back to this website is required when using any quotes, technical analysis charts, or publishing a partial version of an article.


You must be logged in to post a comment.