

In my most recent gold technical analysis published on Apr. 15, A Gold Chart Royal Flush and Volume Record is Freaking Meowt, I noted…
“As winter refuses to leave my window view… 1) Beware of the cartel because a mini-puke at this intersection would fit their usual modus operandi and best interests. 2) The buy volume on the charts printed a rocking record this week.”
I am not surprised, but I’m still freaked out because the cartel had the chutzpah to hit the price, again, at the same resistance and support levels from 2013 to present day, despite an uncanny, bullish set-up, which appears to be exactly why it occurred. In hindsight, keeping a neutral near-term stance as I have throughout 2018 and sticking to my original call to wait until $1,380 is taken out decisively on volume (instead of printing bullish on the last chart due to record volume leading up to the targeted level) would have been the appropriate call. I do rest with a clear conscious in knowing, as a warning was clear and given without hesitation.
Despite the pullback, the gold chart has remained in a primary bull phase since the Dec. 2015 low, and no serious technical damage has taken place during recent price weakness. I will revert to a neutral near-term stance, with a caveat that this temporary weakness in price has provided an opportunity to consider low-risk entry points if laddering core positions or scalping high-volume price spikes up to the $1,380 resistance area. Here are a few articles to consider on the fundamental side of the fence, then on to the charts.
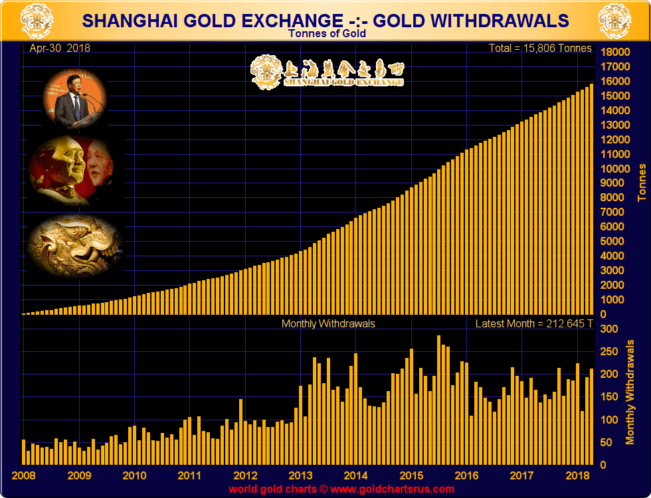
Official Gold Reserves as of Mar. 2018 – World Gold Council


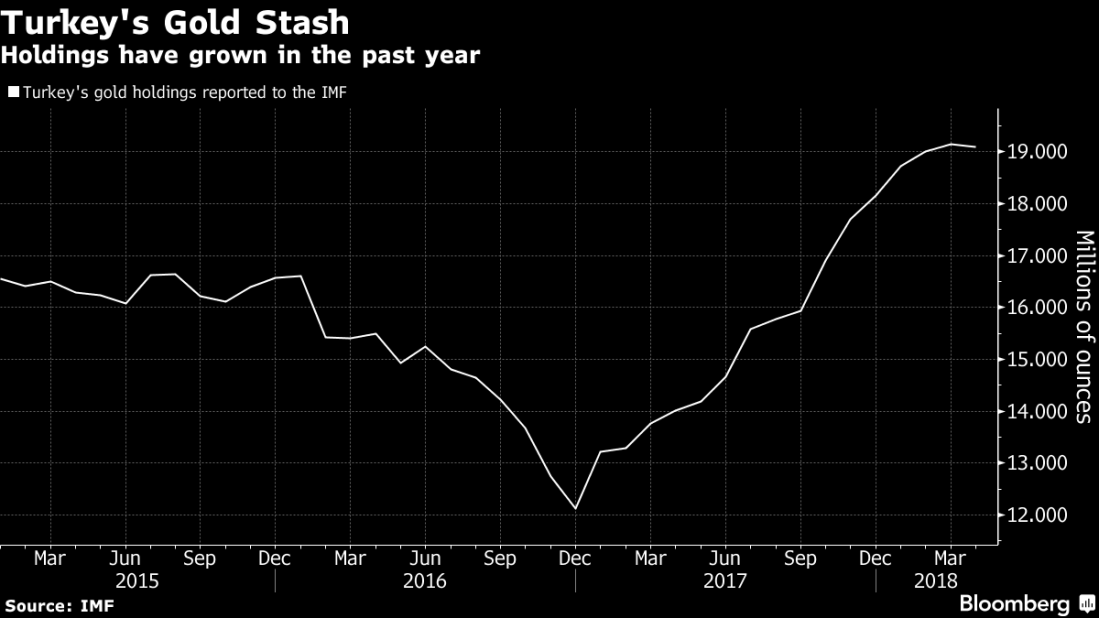
Turkey Repatriates All Gold From The US In Attempt To Ditch The Dollar – ZeroHedge, May 20
Gold Market Charts – BullionStar, May 21


The “Axis of Gold” (China, Russia, Iran, Turkey) Will Drive Gold Higher by the End of 2018 – Jim Rickards at TheDailyReckoning, May 24
Gold Price Surges To Record In Turkey and Other Emerging Markets as Currencies Collapse – Goldcore, May 25

Turkey‘s Election Angst Is Driving Up Demand for Gold Coins – Bloomberg, May 25
Meghan Markle Makes Gold Sales Sparkle… “The first three months of the year were the strongest first quarter for gold jewelry demand in the United States since 2009, according to the World Gold Council. Sellers say that is due in no small part to the public’s fascination with American actor Meghan Markle, who was engaged to Britain’s Prince Harry last November and who married him in a dazzling ceremony on Saturday.” – U.S. News, May 25
As Russia’s Gold Hoard Soars, Putin Warns “US Sanctions Hurt Trust In Dollar As Reserve Currency” – ZeroHedge, May 26
Keep eyes on how the ECB responds to the current crisis in Italy…
Traders are worried this could be the ‘big unwinding’ of Italian bond markets – CNBC, May 28
On to the charts. To view a larger version of any chart, right-click on it and choose your “view image” option.
Gold spot weekly chart and analysis from the Apr. 15 article…

“The most important study on this week’s chart is the record volume print. With an Inverse Head & Shoulders (completed on a chart posted on Twitter on Apr. 11 ) where you have buy volumes rise along with the price after the center of gravity low (head) that continues to rise through the remainder of the head and right shoulder, it is a very bullish indicator that substantially lifts the odds for upside breakouts. It is also better for the price to pull back after testing a neckline, then pivot to a breakout for a sustainable rally. The volume was not just higher this week, it blew away all previous counts. The rising volume pattern not only occurred through the right half of the longer-term Inverse H&S drawn back to 2013, it’s also occurring with a vengeance on the shorter timeframe Inverse H&S within the right shoulder of the longer-term pattern. A double whammy… The bullish Golden Cross that took place during Sep./Oct. 2017 continues to spread upward. The DMI-ADX has shifted to a more positive stance with an Alligator Tongue set-up. The StochRSI rolled over to the negative for a few weeks but has pivoted back up and shows a good chance of breaking out. All moving averages remain south of the price action. I still see the $1,380 Fibonacci level breakout as imminent. As noted earlier, beware of the cartel because a mini-puke at this intersection would fit their usual modus operandi and best interests. If they fail, the mother of all short squeezes could take hold.”
Gold spot weekly chart as of May 25, 2018 close…

The 2018 price action has been a pattern-morphing bonanza, to say the least. Following a seven-week price run from $1,236 to $1,366 from Dec. 2017 through Jan. 2018, a high and tight Flag pattern dominated through to March, which became a pretty Inverse Head & Shoulders with a record volume (see the fluorescent green highlight) spike to complete the right shoulder up to the neckline, and the current price decline has created a Right-Angled Descending Broadening Formation potential. The odds of a near-term breakout if the current pattern holds true are 66%, compared to 90% with the original Flag. Keep in mind that the Flag’s topside trendline was taken out on a buy volume spike, but did not penetrate the high of the flagpole (see Apr. 15 chart).
Despite the pullback and pattern change, there has not been serious technical damage. Both trendlines drawn up from recent lows were not breached to the downside. The trendlines drawn down from the 2011 and 2013 highs remain a distant memory. A Golden Cross that took place during Sep./Oct. 2017 continues to spread upwards. The 50 Exponential Moving Average (EMA), 300 Simple Moving Average (SMA), and 23.6% Fibonacci were briefly breached to the downside, but the price printed back above them at $1,301+ on Friday’s 5pm FOREX close. The price pivoted off the 100 EMA over the last two weeks, and the 200 EMA was not touched. There is a strong support zone where the 200 EMA and lower trendlines meet around $1,275, as well as at the $1,250 38.2% Fibonacci zone. The DMI-ADX study is now indecisive, and the StochRSI study has based for five weeks, with an upward turn last week. The overall volume remains very healthy and in record territory, with rising volume on rising prices and lowering volume on pullbacks.
The chart remains Bullish long-term and Neutral near-term, with an opportunity to ladder additional core positions, as well as scalp any price spikes with volume on the way up to $1,380.
Frank Sinatra – “That’s Life”
Plan Your Trade, Trade Your Plan
TraderStef on Twitter
Website: https://traderstef.wordpress.com
Originally published on May 28, 2018 by TraderStef at CrushTheStreet .

