

As noted in my “Gold Volume Alert – Continuation or Reversal of Trend Imminent” Jun. 27 analysis…
“Sudden shifts in volume characteristics always precede short-term or long-term trend reversals or decisive continuations… What is currently taking place in the world of volume is not a joke. My most recent technical analysis on Jun. 15 reinforced the fact that despite a rollover in price when $1,300 breached to the downside, which coincided with big pockets building upside positions on large volume, no major technical damage occurred on the weekly chart. The low has not breached a Fibonacci convergence level and a trendline that would result in serious technical damage to the weekly chart. As the price drama plays out, mainstream financial media is howling over a potential Death Cross taking hold on the daily chart, but ignore the Golden Cross that remains in play on the weekly chart. Here is the skinny. Since 5am EDT on Monday Jun. 25, gold spot volume has dwarfed any previous historical data. Nobody that followed gold over the last two decades has witnessed such an event. It does not appear to be a glitch in a feed, because the pattern holds firm when drilling down through all periods from 1 second up to the monthly. The current increase is nothing short of incredible, and is a battle between large speculators, the bullion banks, shorts and longs. Unprecedented paper positions on the buy-side of the ledger are humming along because it is a very low risk price zone from a fundamental and technical point of view.”
Chris Duane over at Silver Shield (aka Truth Never Told) shared a response from the Netdania folks after sending them an inquiry about the sudden volume spike in silver spot, which he discussed in his most recent video on Jul. 6, “WTF?! MASSIVE PAPER SILVER VOLUME SPIKE ON NETDANIA!”

Here is an explanation from 2013 that remains relevant today. Note that China’s growing influence by inclusion along the quote chain is not covered as “the fix” in London has morphed into an electronic-based platform.
“Many traders use the spot price to track the global price in real-time, rather than the COMEX futures. The physical gold market is essentially an interbank OTC market centered in London. The main participants and quote providers in the spot gold market are the market makers (or gold dealers) who are mainly international banks, including the clearing/bullion banks (LBMA and its clearing members). There are also other gold dealers, and brokers. These gold agents operate in the main physical gold trading centers of London, Zurich and New York, and during Asian hours in Hong Kong and Tokyo. The end client base of these gold dealers and brokers include the majority of the central banks that hold gold, private sector investors, mining companies, producers, refiners and fabricators. The market makers (or gold dealers) can also take positions on their own accounts. The spot price quoted is for one fine troy ounce, and I am assuming that all the quotes are for LOCO London gold. Because of the OTC nature of the physical gold market, there is no volume or last done price, since the quotes come from different sources (not a central exchange where there is always one last traded price and volume data.). However, despite the many sources of quotes, there are only small differences between the different quote providers because of competition to post the best bids and offers, and the fact that dealers and brokers will minimize the differences through arbitrage. The London Fix should serve as a point of convergence for the many sources of spot gold quotes. Contributors are mostly big international banks and ICAP. Netdania says they get quotes from a number of the most active market makers. The Kitco website indicates that their spot quotes come from bullion dealers active in any of the main physical gold trading centers around the world. CNBC spot gold quote appears to be Thomson-Reuters XAU instrument.”
On to the USD and gold charts. To view a larger version of any chart, right-click on it and choose your “view image” option.
Gold spot weekly chart (via Netdania) as of July 6, 2018 close…

The price pivoted off the “line in the sand” lower trendline following a low of $1,237.94 at around 1am EDT on Jul. 3. Any lower would cause technical damage, elongate any price recovery, and require a major rally to precipitate a massive short squeeze to shorten a price recovery. As I covered on numerous occasions, a huge Inverse Head and Shoulders pattern has formed since 2013. The chart above is the right shoulder. The overall pattern is not toast, but perhaps elongated with the current pullback in price below the neckline. With this price pullback, a 2.5-year Ascending Triangle is taking shape as long as the trendline is not breached further to the downside, in turn enveloping the right shoulder. The price is supported by the convergence of two Fibonacci levels, a lateral from the Dec. 2017 low and the lower trendline drawn up from the Dec. 2015 low. A Spinning Top (aka Fat Bodied Doji) candle printed this week and is indecisive, but it leans to the bullish reversal side because the price closed above the previous week’s close. This week’s close printed $1,254.73. The studies are a mixed bag. The Golden Cross is bullish and remains in play, the StochRSI is extremely oversold, and the DMI-ADX is peaking out. The big standout is the ridiculous spike in volume. The high of $1,261.11 printed on Jul. 3 retraced more than 50% of the previous week’s candle, which is indicative of the record buy volume. Big pockets were BTFD.
As noted in my recent analysis…
“The gold chart remains Bullish long-term and Neutral near-term, with opportunities to ladder additional core positions, as well as scalp any price spikes with volume. $1,380 is the number and now requires a $100+ trip.”
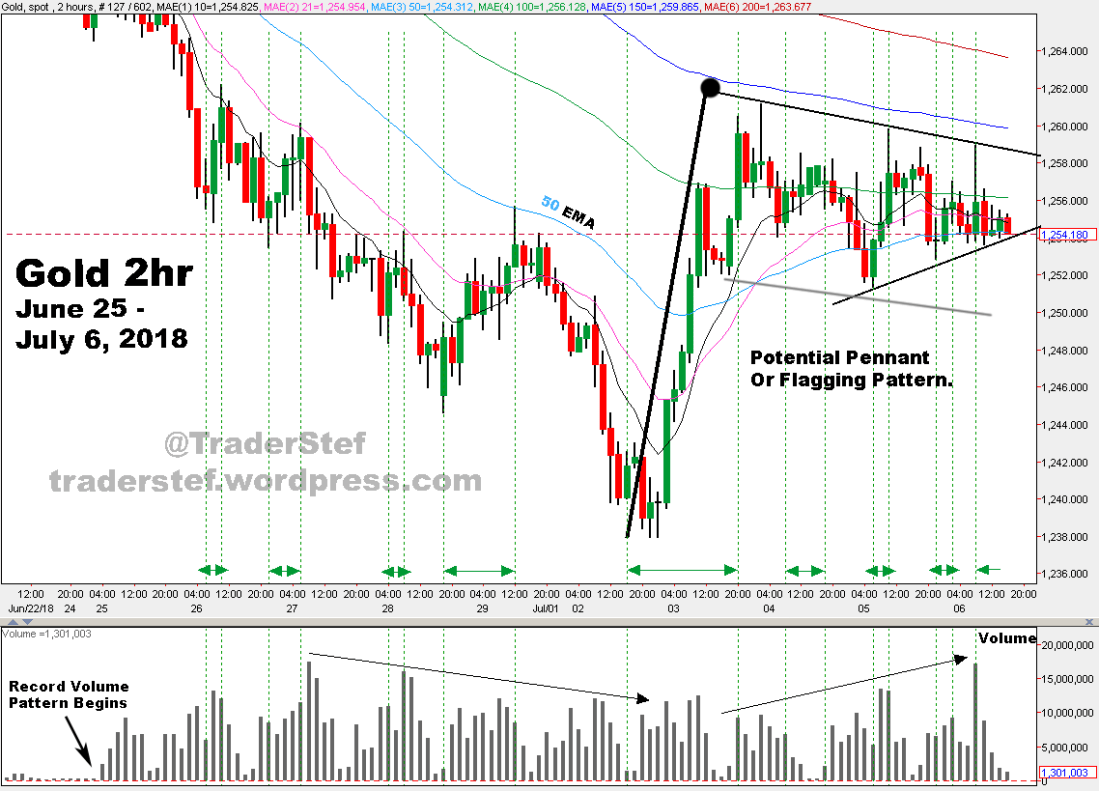
The gold 2-hour chart indicates where the bulk of buy volume came in, delineated into blocks between the green dotted lines. A potential Flagpole & Pennant or Flag pattern is taking shape while the price is surfing the 50 EMA. $1,240 to $1,260 appears to be the low-risk BTFD zone.
————
July 9 overnight update…

————
USD weekly chart as of July 6, 2018 close…
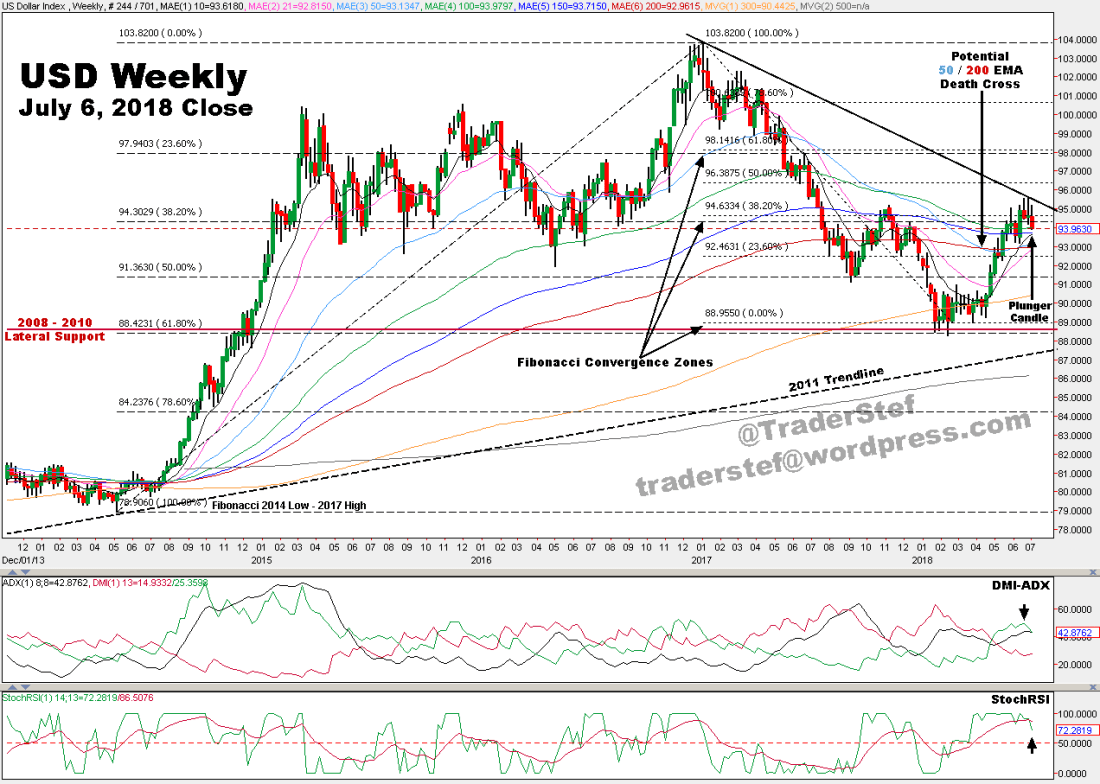
Despite the rally up to the $95 zone, I remain Bearish long-term. The StochRSI and DMI-ADX are rolling over and price printed a Plunger Candle last week, which is indicative of near-term weakness. It appears a Fibonacci convergence zone has put an end to the current rally in the USD.
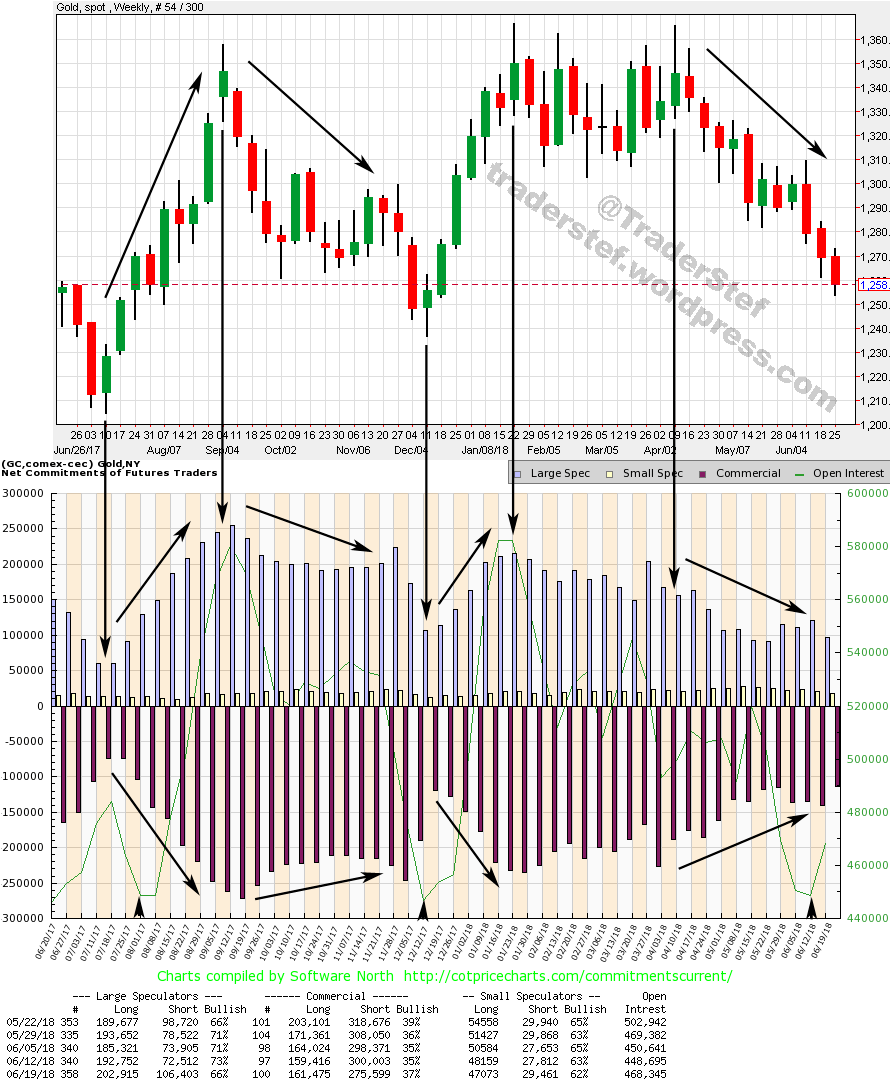
Unfortunately, Commitments of Traders (COT) data was not released on Friday due to the holiday week. I will replace the following chart when the new COT data is released. In the meantime, here is my most recent analysis, overlaid with the weekly gold chart as of 10:15am EDT on Jun. 27. Note the COT net position pattern of highs and lows and total Open Interest (OI is the fine green line, with lows marked by arrows at the base) vs. the gold price candlesticks.
As a reminder, here is gold’s seasonal 30-year average as of June 2018…

Here are a few articles and interviews to peruse this weekend before next week rolls in with a lot on the table:
- The Dollar Is a Source of Global Instability – Jim Rickards, Jul. 2
- Sanctions on Iran to include the auto sector, gold trade, and other key metals – U.S. State Dept., Jul. 2
- Why One Trader Thinks Trade War Will Send The USD Tumbling – ZeroHedge, Jul. 5
- Gold and USD Have No Relationship at all – Ned Naylor-Leyland Bloomberg Interview, Jul. 6
- WGC: Gold Is ‘Invaluable’ To Tech Sector, Higher Metal Demand Inevitable – Kitco, Jul. 5
- Trade War begins: US and China exchange $34 billion in tariffs – CNBC, Jul. 5
- Iranian Cops Crackdown On “Gold Hoarder” Who Collected 250,000 Coins – ZeroHedge, Jul. 5
- Volatility Is on the Way Back – Jim Rickards, Jul. 5
- Confusion as China ports delay U.S. cargoes, disrupting trade – Reuters, Jul. 6
- The fallout in commodities from the U.S.-China Trade war: what’s at stake – Reuters, Jul. 6
- China 2018 YTD gold demand exceeds 1,000 tonnes – Lawrie Williams, Jul. 6
- U.S. China Trade War Escalates as Russia and China Accumulate Gold – GoldCore, Jul. 6
- North Korea calls high-level talks with Pompeo ‘regrettable’ – NYPost, Jul. 7
The following interview with Andrew Magurie stands out today. European banks are defaulting on some gold deliveries.
- Major German Bank Just Refused To Hand Over Client’s Physical Gold – Andrew Maguire, Jul. 7
Plan Your Trade, Trade Your Plan
TraderStef on Twitter
Website: https://traderstef.wordpress.com
Originally published on July 8, 2018 by TraderStef at CrushTheStreet .

