

Originally published on October 30, 2019 by TraderStef at CrushTheStreet.
The U.S. national debt-to-GDP (Gross Domestic Product) ratio as of today’s 2.9% 3Q19 GDP report is 106.5%, otherwise known as bankruptcy if it were not for hegemony over the world’s reserve currency. As a side note, consumer consumption experienced a nosedive to 1.7% vs. an expected 2.6%, which is responsible for roughly two-thirds of GDP.

If you are curious about the U.S. debt-to-GDP ratio as compared to the rest of the world, the IMF has the data and the WSJ Daily Shot provides a chart.

The second-highest debt-to-GDP ratio in U.S. history was 104% due to the Second World War. It declined until the 1980s after President Ronald Reagan began a buildup of the U.S. military. Reagan’s budget blowout led to the resignation of Office of Management and Budget Director David Stockman. The highest debt growth in dollar terms happened under President Barack Obama’s watch, which clocked in at roughly $9 trillion during his two terms in office. The U.S. holds the largest public debt in the world, and as the world’s reserve currency, we have a lot to lose.
As of this afternoon, the national debt is just shy of $23 trillion, the Treasury Department is exploring the issuance of a 50-Year bond for the first time, and second-half 2019 borrowing is estimated to be $769 billion and will be the highest since $1.1 trillion in July-December 2008.

Trillion-dollar deficits are here to stay… “The U.S. deficit has hit its highest point in seven years, at $984 billion in the 2019 budget year, approximately a 26% increase from 2018 and a 48% increase from 2017, according to the U.S. Department of Treasury on Friday. The deficit is the difference between how much the government spends and how much it takes in taxes.. While headlines characterize the soaring deficits in recent years as a product of the Trump administration’s passage of large tax cuts, Americans’ addiction to entitlements, including the passage of the Affordable Care Act, are the true culprits… The deficit is only expected to continue expanding, exceeding a $1 trillion in the next fiscal year, according to the Congressional Budget Office, while lawmakers are showing no signs of cutting entitlement spending even as it gets closer to openly bankrupting the nation.” – The Federalist, Oct. 28
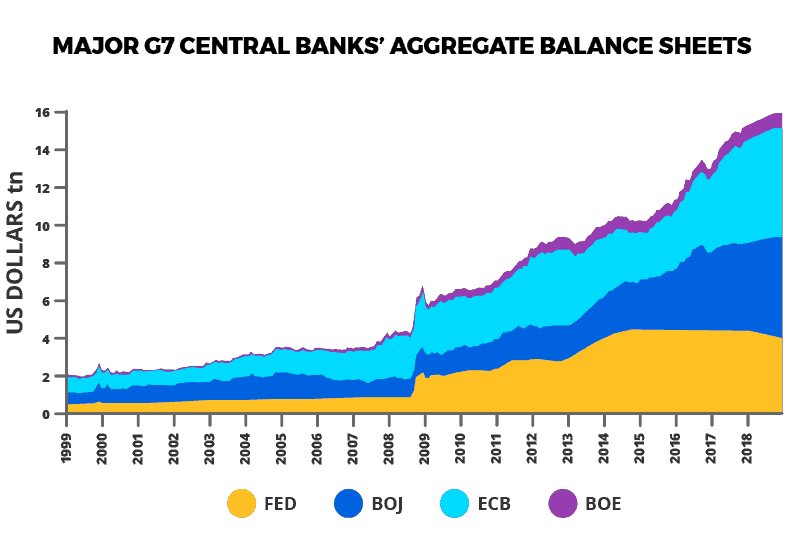
Even though trillions of dollars are printed and pumped into the global financial system by central banks, most notably in earnest since the Great Financial Crisis (GFC), U.S. GDP has continued on a downward trend with markedly lower highs since 1Q84.

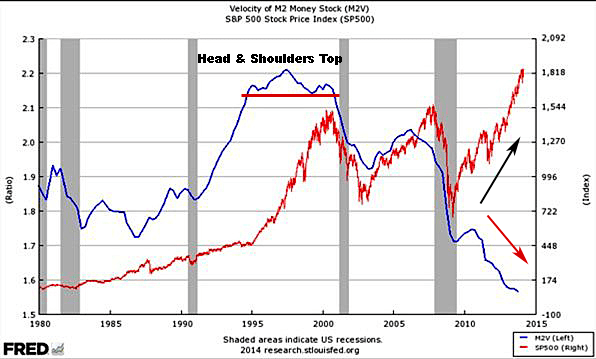
If we compare the Velocity of Money (VoM) to the S&P 500 stock index, take note of the wicked divergence since the GFC and Federal Reserve’s quantitative easing (QE) that began in 2008. A divergence on any chart is rarely a good sign.
“The velocity of money is a measurement of the rate at which money is exchanged in an economy. It is the number of times that money moves from one entity to another. It also refers to how much a unit of currency is used in a given period of time. Simply put, it is the rate at which consumers and businesses in an economy collectively spend money. The velocity of money is usually measured as a ratio of gross domestic product (GDP) to a country’s M1 or M2 money supply… High money velocity is usually associated with a healthy, expanding economy. Low money velocity is usually associated with recessions and contractions.”
“VoM M1 is the narrowest component. M1 is the money supply of currency in circulation (notes and coins, traveler’s checks [non-bank issuers], demand deposits, and checkable deposits). A decreasing velocity of M1 might indicate fewer short- term consumption transactions are taking place. We can think of shorter- term transactions as consumption we might make on an everyday basis.” – FRED

“The broader M2 component includes M1 in addition to saving deposits, certificates of deposit (less than $100,000), and money market deposits for individuals. Comparing the velocities of M1 and M2 provides some insight into how quickly the economy is spending and how quickly it is saving.” – FRED

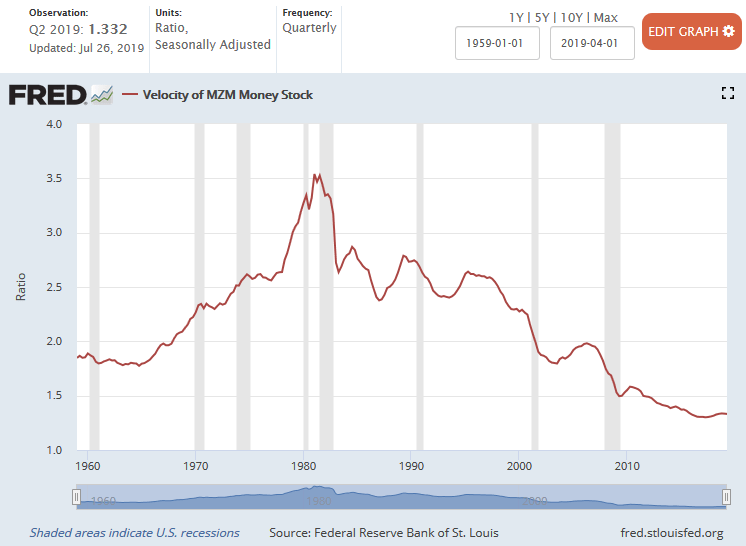
“MZM is the broadest component and consists of the supply of financial assets redeemable at par on demand: notes and coins in circulation, traveler’s checks (non-bank issuers), demand deposits, other checkable deposits, savings deposits, and all money market funds. The velocity of MZM helps determine how often financial assets are switching hands within the economy.” – FRED
The Federal Funds Rate is the interest rate set by the Federal Reserve at FOMC meetings, and that rate along with GDP and VoM have continued on a downward trend since the 1980s.

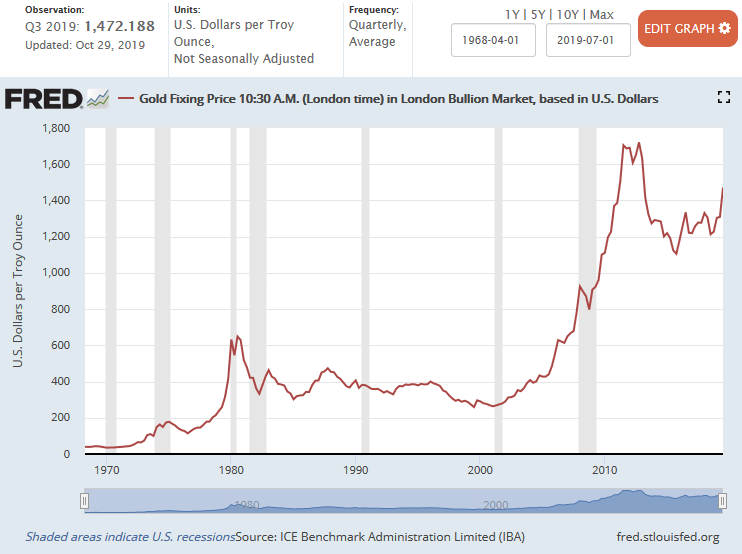
Let us now consider the gold price in U.S. dollars since 1968.
“While the ninth inning of uncharted monetary policy is borderline musical chairs, the super rich are selling stocks, buying real assets, and keeping cash at the ready. Asia’s wealthy prefer physical gold, and central banks around the world are hoarding the pet rock in a frenzy not seen for 50 years.” – TraderStef, Aug. 2018
-
Real Negative Interest Rate Policy (NIRP) Vs. Gold – TraderStef, Apr. 2019
-
“Gold loves NIRP. That means it is bad for everything else.” – Bianco Research, Sep. 3

-
The “Not QE” TaperCaper Duck Quacks Like QED – TraderStef, Oct. 11
-
Negative interest rates can boost the economy, Fed paper says – Fox, Oct. 16
-
Fed Cuts Rates, Drops “Act As Appropriate” Going Forward – Zerohedge, Oct. 30
“The truth is we are living the largest intentionally created global bubble in financial assets the world has ever seen. Sovereign debt across the world is trading at negative interest rates never seen previously. Thousands of years of debt history and nothing like this.” – Michael Krieger, Oct. 30
The Ugly Truth about the Federal Reserve – Real Vision w/ Danielle DiMartino Booth, Oct. 28
Plan Your Trade, Trade Your Plan
TraderStef on Twitter
Website: https://traderstef.wordpress.com
————

NONE of the content produced by TraderStef, staff members, or any services associated with this website should be construed as financial or investment advice. Financial investment is a risky endeavor and may lead to substantial loss. Always perform due diligence before undertaking any financial decision. Not a Financial Advisor.
Copyrighted Material – A “by TraderStef” credit linked back to this website is required when using any quotes, written material, technical analysis charts, or publishing a full version of an article.
————


You must be logged in to post a comment.