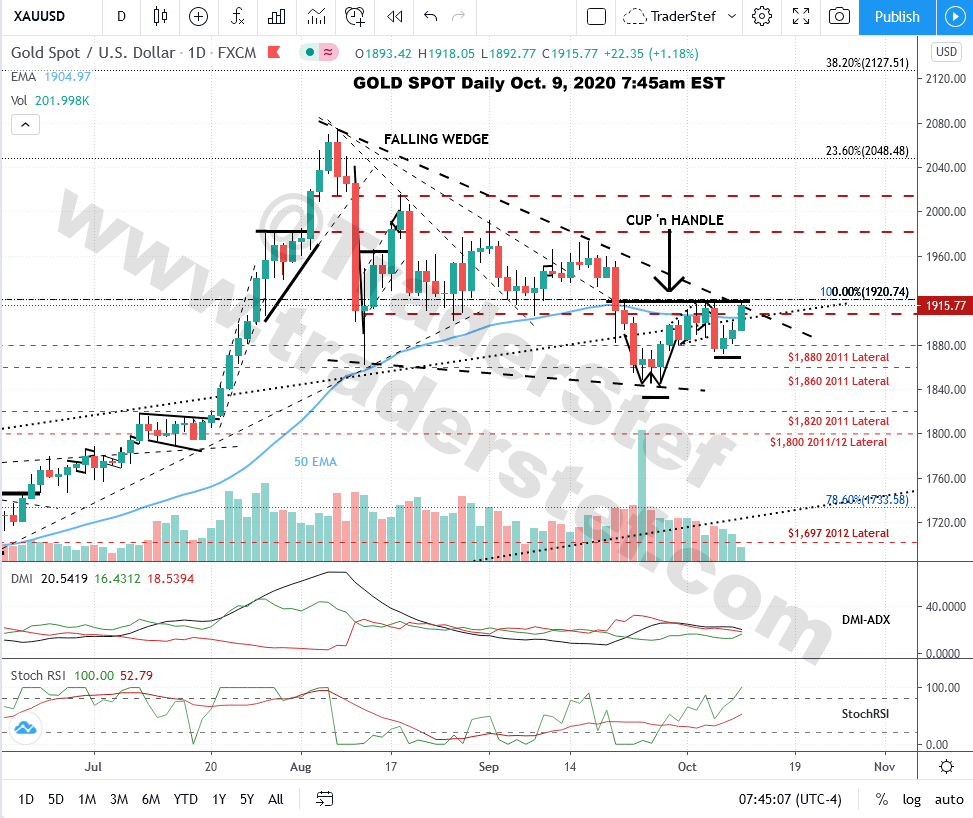
Heads-up. A potential sweet spot is brewing this morning if gold spot breaks out above the Cup ‘n Handle Rimline at $1,920ish, the previous all-time-high lateral that has become a support/resistance area. Silver shows an Ascending Triangle within the same time-frame and will follow gold’s lead.
Plan Your Trade, Trade Your Plan.
Headline collage art always by TraderStef
NONE of the content produced by TraderStef™, staff members, or any services associated with this website should be construed as financial or investment advice. Financial investment is a risky endeavor and may lead to substantial loss. Always perform due diligence before undertaking any financial decision. Not a Financial Advisor.
Copyrighted Material – A “by TraderStef” credit linked back to this website is required when using any quotes, technical analysis charts, or publishing a partial version of an article.


One thought on “Gold Chart Exclusive for Precious Hour Subscribers – Technical Analysis”
Comments are closed.