

Originally published on May 24, 2022 by TraderStef at CrushTheStreet
A lot can be said about what’s happening in the world and why the stock market is trending into a bear market within our bankrupt reality. As WWIII knocks on the front door and inflation robs every household budget, a deep recession is taking shape right around the corner, credit market conditions are on the verge of collapse, interest payments on the national debt are unsustainable, the Fed’s REPO operation is hyperinflating to provide liquidity to unknown entities, Biden’s energy and domestic policies are a complete disaster, the global supply chain crisis is worsening, and the Fed’s commitment to tightening its monetary policy into a weak economy will expose the Emperors’ Taper Caper. In the meantime, the WEF is partying in Davos while tweaking their NWO Great Reset plan and couch potatoes are masking over monkeypox or voyeur Johnny Depp and Amber Heard’s dirty laundry in a public spectacle. Did I miss anything? A must-see Ed Dowd interview will fill in the blanks at the end of today’s technical analysis.
- Fed REPO Facility Tops $2 Trillion as Investors Scramble to Park Cash – Bloomberg, May 23

- April Data Indicate Worsening of Supply Chain Pressures – FRBNY

Here is an excerpt from Part 1 on April 24:
“Today’s overview is strictly for technical analysis grunts. The world is in a hot mess as NATO’s proxy war with Russia inside Ukraine will not end anytime soon, the ongoing supply chain crisis is set to deliver another fatal blow to the U.S. with China’s largest cities and shipping hubs in a perpetual pandemic lockdown, the Fed’s blowing monetary policy smoke for another Taper Caper that’s primed to implode the U.S. economy into recession sooner than later, and a nasty inflation bug is biting more deeply as each week passes… Don’t be a hero and impale yourself with falling knives. The takeaway from Jan. 21 is more relevant today than it was three months ago: ‘Caution is warranted in this long and short scalping environment and layering capital into long-term positions is not recommended at this time.’”
Let’s go to the Dow, S&P 500, NASDAQ 100, and Russell 2000 charts and see what happened since the end of April. Keep in mind that when the Fed reverses back to money printing mode, the markets will rally until the end game plays out. To view a larger version of any chart below, right-click on it and choose the “view image” option.
$DJI Dow Jones Industrial Index weekly chart as of May 24, 2022 4pm ET…

Excerpt from the Dec. 31, 2021 weekly chart analysis:
“The third tap on Ascending Broadening Wedge‘s lower trendline was nearing the elusive 50 Exponential Average (EMA). The subsequent pivot reached an all-time high this week, but ended with a bearish Plunger Candle (aka Shooting Star).”
Excerpt from the Jan. 21, 2022 weekly chart analysis:
“Price action on the Dow made a slightly higher all-time high in early January, then proceeded to rollover on negative economic news and data as headlines about Russia and the U.S. butting heads over Ukraine came to the forefront. The first weekly candle following Dec. 31, printed a clean and bearish Shooting Star with a substantial increase in sell Volume which reinforced the previous week’s bearish Plunger candle… The DMI-ADX setup could morph into a negative power trend if an Alligator Tongue takes hold, the StochRSI is trending negative, and sell Volume increased substantially over the last three weeks. The chart is bearish, and will become more bearish if the 50 EMA is breached on heavy sell Volume.”
Excerpt from the Apr. 22, 2022 weekly chart analysis:
“The charts are definitely having a bearish Plunger Candle party. During the week of Jan. 24, the Dow fell below the 50 EMA and lower trendline of the Ascending Broadening Wedge. That event printed the first downside stairstep. The price pivoted to the upside in a classic Throwback pattern, and was followed by two Plungers that launched a waterfall and tapped the 23.6% Fibonacci (confluence with a Fibonacci Extension). That marked the second downside stairstep with a long-tail Dragonfly Doji. The Dragonfly did not close above the 50 EMA and resulted in two weeks of downside price action. The subsequent rally printed a Marubozu candle and solidified a lower trendline that’s drawn up from the Nov. 2020 election low. That rally did not last long, as the next three candlesticks were Dojis and included an Evening Doji Star at the high. That’s indicative of major indecision and led to another Plunger candle close with the Dow plummeting 916 points on Friday… Any lateral support that remained at the Tweezer Bottom from Jun. 2021, was wiped out with the sell-off to the second downside stairstep… The situation is precarious. One negative headline could quickly drive the price down to a third stairstep where large buy Volumes will provide some support from Mar. 2021 at the 23.6% Fibonacci Extension level around 31,422. The number three is very common in technical analysis and I must assume the chart is on its way to a third wave down. The chart is bearish and a scalping environment for professional traders.”
From a high of 36,953 in Jan. 2022 to the 30,636 low last week, the Dow has lost about 17%. The official bear market measure is a 20% correction (29,562) but recent volatility is indicative of a bear as each rally morphs into a dead cat bounce (aka a sucker’s rally).
The Plunger candle on Apr. 22 did not lie. The subsequent price action never closed back above the 50 EMA and the lower trendline was taken to the woodshed during the last week of April and first week of May. The downward price trend followed through the second and third week of May and last week’s low printed a third stairstep down. That candle closed on the 23.6% Fibonacci Extension where support was found within a few candlesticks with decent buy Volume from Jan. and Feb. of 2021.
The DMI-ADX remains in a negative trend and is currently muted, the StochRSI is looking for a rally that could turn into dead cat bounce, and sell Volume increased with a falling price which is indicative of more weakness that may lead to another stairstep down. Support at the 38.2% Fibonacci retrace level is weak at 29,794. If last week’s low is violated with conviction in the near future, the price action will likely probe the official bear market target at 29,562. The chart is bearish and a scalping environment for professional traders.
$SPX S&P 500 Index weekly chart as of May. 24, 2022 4pm ET…

Excerpt from the Dec. 31, 2021 weekly chart analysis:
“This week saw a new all-time high of 4,808.94 and ended with a bearish Plunger Candle close at 4,766.19… The 50 EMA is trailing far below the price action since the 2020 election and is overdue for a visit.”
Excerpt from the Jan. 21, 2022 weekly chart analysis:
“In similar fashion as the Dow, the S&P 500 printed a slightly higher high immediately after 2022 chimed in and began rolling over… A Plunger candle was followed by a Bearish Engulfing candlestick, then a Long Legged Doji that’s indicative of indecisiveness, and finally this week’s bearish Marubozu candle cut through the 4,530 lateral support like butter and breached the Ascending Broadening Wedge’s lower trendline… The chart is bearish and will become more bearish if 4,279 is breached with conviction. If things really get ugly, 4,060 is the next bus stop.”
Excerpt from the Apr. 22, 2022 weekly chart analysis:
“The SPX came close to printing 4,060 on its second stairstep to the downside during the week of Feb. 22. The candlestick story is nearly identical to the Dow and not worth repeating. The DMI-ADX and StochRSi are more bearish than the Dow, the sell Volume characteristics are similar, and the 50 EMA was cleanly breached to the downside. Support levels below 4,060 are all nicely situated around the Fibonacci levels. I must assume the chart is on its way to a third wave down. The chart is bearish and a scalping environment for professional traders.”
The SPX has plunged 21% from its high of 4,819 in Jan. 2022 to the 3,810 low last week. It will officially meet the qualification of a bear market if 3,810 is breached with conviction. The price action that followed the Apr. 22 Plunger candle never closed back above the 50 EMA and briefly hesitated before slicing through lateral support at 4,060. The 3,810 low printed the third stairstep down and was a stone’s throw below the 38.2% Fibonacci confluence at 3,815. The SPX is also having a dead cat bounce party and the bear has a 3,720 lateral and the 23.6% Fibonacci Extension level in its sights. Candlestick support from Jan. and Feb. 2021 do not have a lot of buy Volume and adds to my suspicion that a fourth stairstep is likely.
The DMI-ADX remains in a negative power trend, the StochRSI is struggling to rally, and sell Volume has risen along with a falling price. The chart is bearish and a scalping environment for professional traders.
$NDX Nasdaq 100 Index E-Mini Futures weekly chart as of May 24, 2022 4pm ET…

Excerpt from the Dec. 31, 2021 weekly chart analysis:
“After printing an all-time high of 16,767.50 in the fourth week of November, the price action has been volatile with large sell Volume spikes and falling buy Volume into the holiday season. This week closed with a bearish Gravestone Doji.”
Excerpt from the Jan. 21, 2022 weekly chart analysis:
“The Up Channel’s lower trendline was decisively breached this week with a bearish Marubozu candle. The downside price action was halted in its tracks slightly above the 23.6% Fibonacci level, and just below the 50 EMA. The DMI-ADX is not set up with the perfect Alligator Tongue for a negative power trend with the black ADX line piercing the green DMI from below, but it must still be respected. The StochRSI has broken down and is skimming along oversold territory… The chart is bearish and will become more bearish if 14,030 is breached on decisive sell Volume. The 38.2% Fibonacci at 12,894 would be the next target.”
Excerpt from the Apr. 22, 2022 weekly chart analysis:
“Always trust your indicators and studies. Respecting them is better than getting whacked or playing with knives. 14,030 has been violated twice along with the 50 EMA. A third wave down is very likely. Support levels below the 38.2% Fibonacci are clearly marked on the chart. The chart is bearish and a scalping environment for professional traders.”
The NDX has plunged 31.5% from its high of 16,767 in Nov. 2021 to the 11,491 low last week. That meets the qualification for a bear market and a good reason to not play with falling knives. The technical set up is nearly identical to the SPX and not worth repeating. Current support at the 50% Fibonacci level is provided by a few candlesticks with solid buy Volume from Aug. through Nov. of 2020. Another stairstep down is likely if a dead cat bounce develops and support will surface at the 10,942 lateral and 61.8% Fibonacci retrace at 10,501. The chart is bearish and a scalping environment for professional traders.
$RUT Russell 2000 Index E-Mini Futures weekly chart as of May 24, 2022 4pm ET…
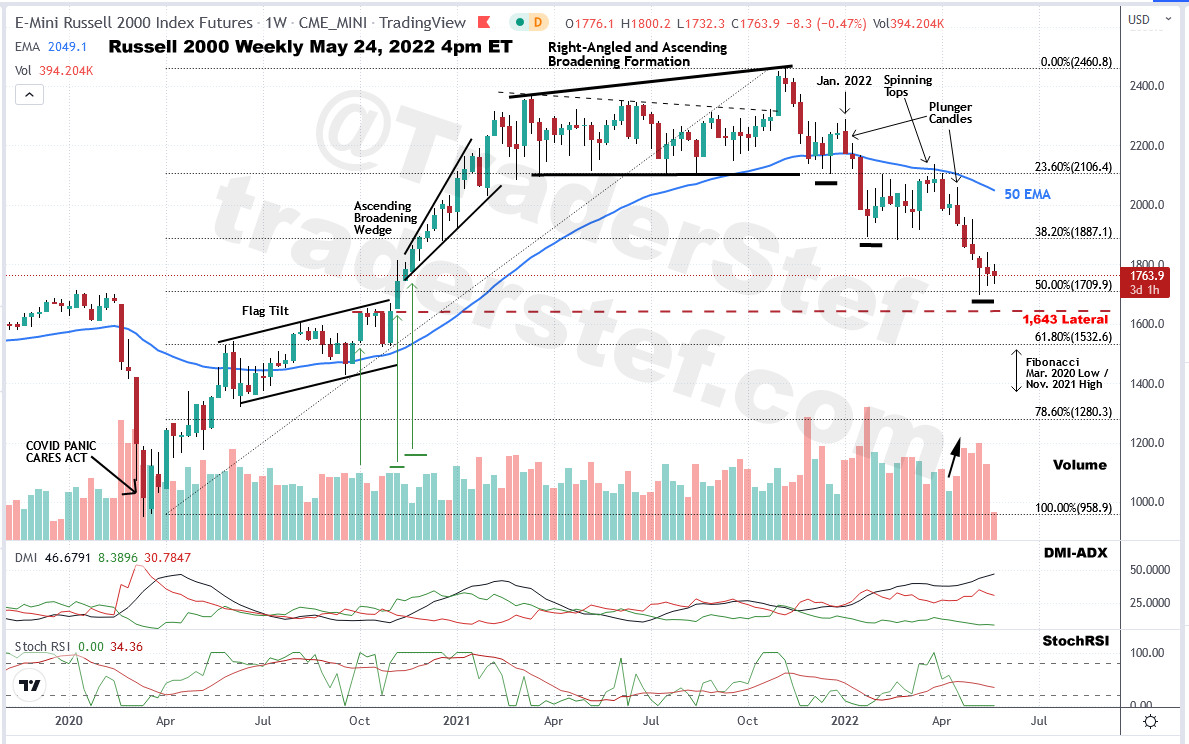
Excerpt from the Dec. 31, 2021 weekly chart analysis:
“Last week’s rally provided the momentum that pushed the price above the red trendline this week. The price action closed at 2,242.80 and printed an indecisive Spinning Top candlestick… If the (50 EMA) and 23.6% Fibonacci is breached to the downside on large sell Volume, watch out below.”
Excerpt from the Jan. 21, 2022 weekly chart analysis:
“Spinning Tops must be closely watched and it was the peak of a Dead Cat Bounce to end 2021. The following week printed a Plunger on top of the 50 EMA and last week another Spinning Top. This week’s Marubozu candle put a fork in the pig and decisively breached the Right-angled Ascending Broadening Formation’s lower trendline… There is a chunk of buy Volume in 4Q20 that will provide support as the price action chops downward to the 38.2% Fibonacci level, and potentially the 50% Fibonacci where support exists. The DMI-ADX is in a negative power trend with an Alligator Tongue on the rise, the StochRSI is skimming along oversold territory and could remain there for an extended period of time, and the sell Volume is huge and trending upwards. The Russell is the most bearish among the indices. Hang on tight and wait for a bottoming pattern to emerge before committing any long positions.
Excerpt from the Apr. 22, 2022 weekly chart analysis:
There is nothing significant that can be added to the Jan. 21 commentary. If the 38.2% Fibonacci is breached to the downside with conviction, the price action could easily transition into a third wave down and tap the 50% Fibonacci level around 1,700 or so. The chart is bearish and a scalping environment for professional traders.
RUT has plunged 31% from its high of 2,461 in Nov. 2021 to the 1,698 low last week. That meets the qualification for a bear market along with the NDX. The technical set up is nearly identical to the NDX but the DMI-ADX has retained more momentum in its negative power trend. Last week’s low printed the third stairstep down at the 50% Fibonacci retrace level. Another stairstep down is likely if a dead cat bounce develops and support will surface at the 1,643 lateral and 61.8% Fibonacci retrace level. The chart is bearish and a scalping environment for professional traders.
Ed Dowd: The Four Converging Forces That Will Destroy the Economy – May 21
Plan Your Trade, Trade Your Plan
TraderStef on Twitter, Gettr, Gab / Website: TraderStef.com
Headline Collage Art by TraderStef

NONE of the content produced by TraderStef, staff members, or any services associated with this website should be construed as financial or investment advice. Financial investment is a risky endeavor and may lead to substantial loss. Always perform due diligence before undertaking any financial decision. Not a Financial Advisor. Copyrighted Material – A “by TraderStef” credit linked back to this website is required when using any quotes, written material, technical analysis charts, or publishing a full version of an article.


2 thoughts on “Dow, Nasdaq, S&P, and Russell for Spring 2022 – Technical Analysis Part 2”
Comments are closed.