

Originally published Oct. 25, 2023 by TraderStef on CrushTheStreet (updated)
It has been a year since I penned the last chapter in a series on the housing market, and it’s time to look at what transpired since last summer and fall. The affordability factor has worsened, there are rising interest rates for mortgage debt, prices remain elevated for new and existing homes, and there’s a paucity of worthy inventory since many homeowners are unwilling to sell that refinanced and/or purchased a home amid the pandemic diaspora before the Federal Reserve launched the aggressive phase of quantitative tightening (QT) monetary policy in mid-2022. There’s also an impending commercial real estate (CRE) implosion and fire sale that will escalate next year, a U.S. hard-landing recession is brewing in a slowing economy, and there’s the WW3 chessboard manifested in Ukraine vs. Russia via NATO’s proxy war going on since Feb. 2021 that metastasized into Israel and the Middle East this month.
“You want to be greedy when others are fearful. You want to be fearful when others are greedy. It’s that simple.” – Warren Buffett
Recent real estate buying sentiment and its various data points appear to have entered a capitulation phase that mirrors the slowest years of the Great Financial Crisis (GFC) housing bust to boom cycle. A contributing factor to that assessment is the return of rent vs. buy arguments appearing across the press as plebes struggle with sticky inflation, constrictive expense budgeting on the home front, and a plunge in disposable income and savings. While reviewing the following article and video presentation, be mindful that buying an affordable property or homestead in an optimal locale with plans to settle down for the long haul is typically a wise choice. But if you are itching to purchase with no pressing circumstances to do so and view the next few years as a transition to better opportunities, renting from now until the market bubble reverts to reality is a practical option. In the meantime, you can ladder capital into high-yield, short-term Treasuries and CDs and other investment options that increase the potential for a cash purchase or just grow that down payment fund.
Homes “unaffordable” in 99% of nation for average American… “That’s the main takeaway from a new report from real estate data provider ATTOM. Researchers examined the median home prices last year for roughly 575 U.S. counties and found that home prices in 99% of those areas are beyond the reach of the average income earner, who makes $71,214 a year.” – CBS News, Sep. 28
There’s Never Been a Worse Time to Buy Instead of Rent… “The cost of buying a home versus renting one is at its most extreme since at least 1996. The average monthly new mortgage payment is 52% higher than the average apartment rent, according to CBRE analysis. The last time the measure looked out of whack was before the 2008 housing crash. Even then, the premium peaked at 33% in the second quarter of 2006… From 1996 to mid-2003, the average cost to buy or rent did indeed work out more or less equal. After the global financial crisis, though, rock-bottom interest rates and plenty of housing supply meant it was 12% cheaper on average to buy a home than to rent one during the 2010s. The current hefty ownership premium reflects the surging cost of debt, as rates on a 30-year mortgage reach 8%, as well as high house prices since pandemic lockdowns raised the value of domestic space. A 30-year mortgage today on a $430,000 home with a 10% down payment would fork out around $3,200 in monthly repayments, 60% more than if they had bought the same house three years ago.” – WSJ via MSN, Oct. 22
Renting vs Buying A Home: Which Is Actually Cheaper? – Graham Stephan, Oct. 11
Let’s move on to a few data metrics and begin with an excerpt I penned in Aug. 2022:
“Sellers are still trying to lock in bubble territory pricing for their homes, but a majority of buyers are saying take a hike as inventory rises and prices drop. Housing values will continue to plunge until sellers figure out where the buyers are, and they’re going a lot lower.” – TraderStef, Aug. 17
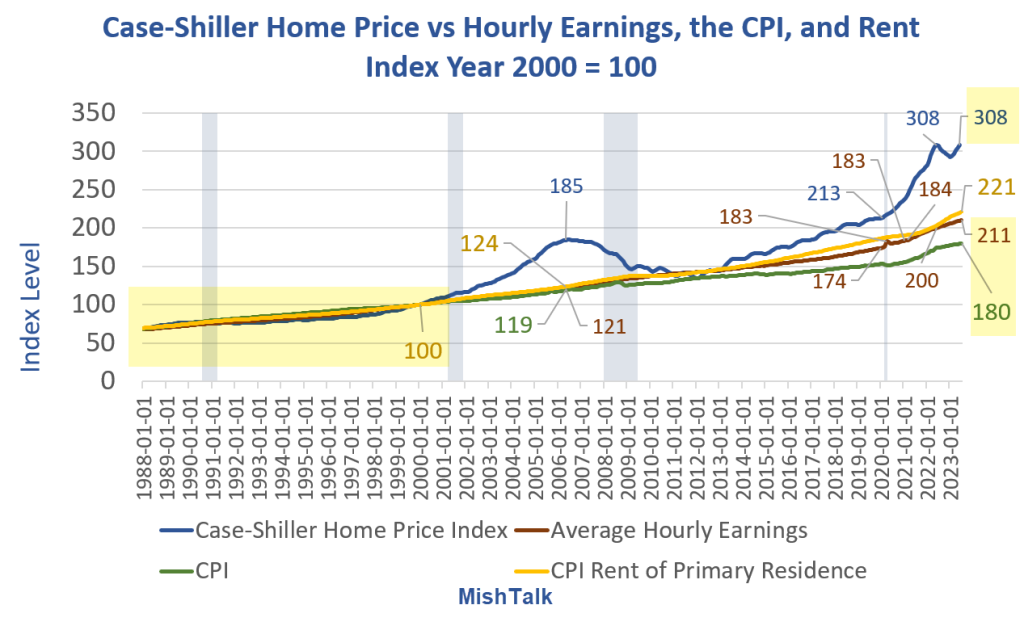
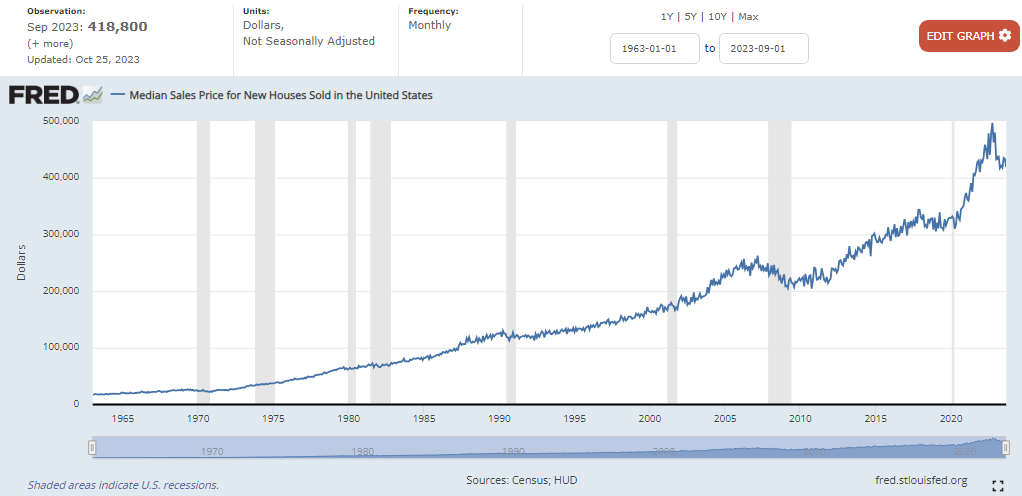
Overall, the median sales price is down 10%-13% since the 2022 high of $479,500. The median home price in Sep. 2023 is $431,000 after printing a $418,500 low in 2Q23:

U.S. housing affordability is at a record low:

Mortgage interest rates at 8% are the highest levels since Y2K:

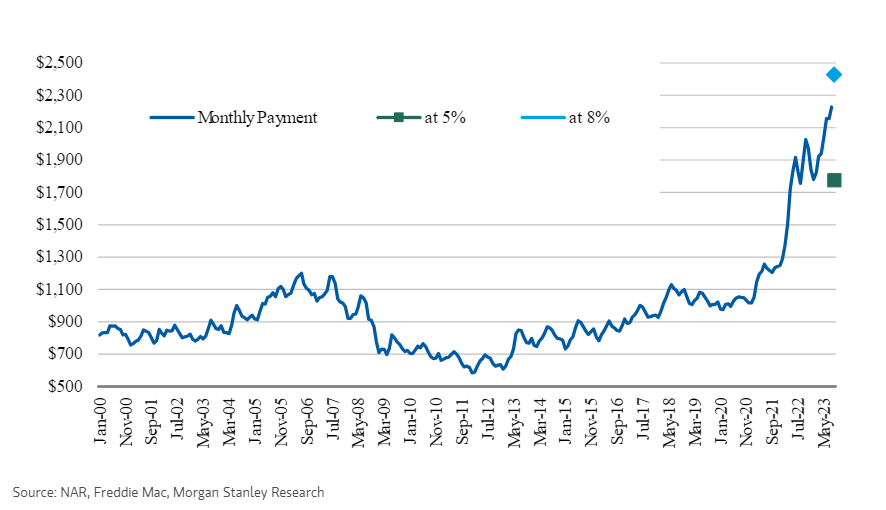
A monthly 30-year mortgage payment courtesy of Bidenomics:
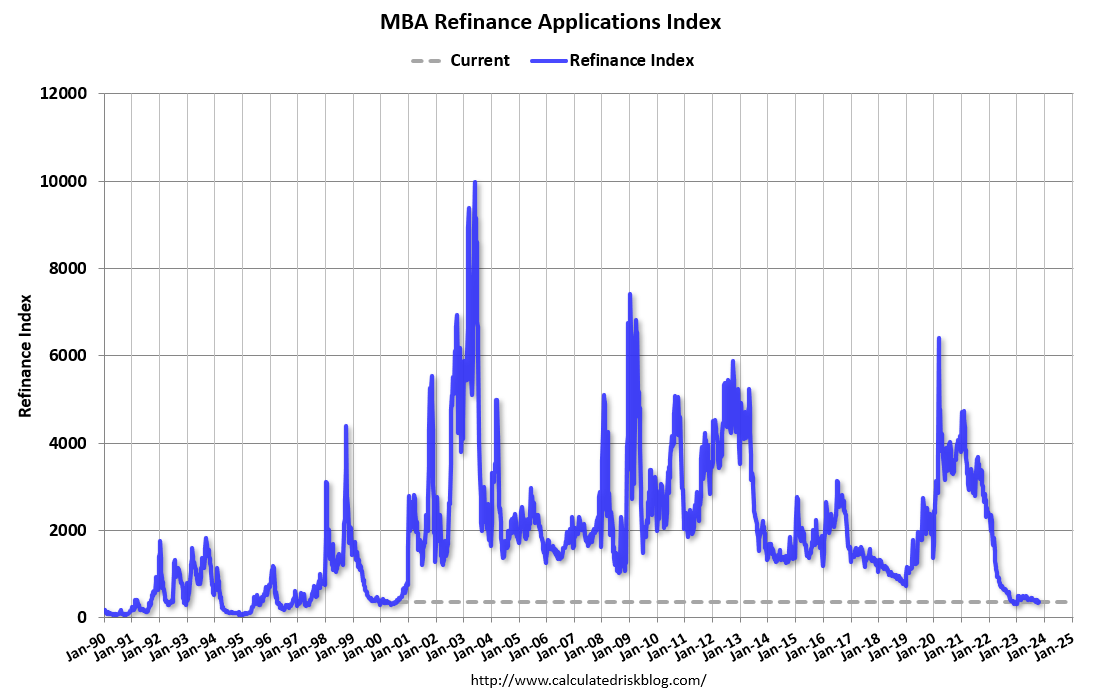
Mortgage and refinance applications are crashing through the floor:


Home sale price reductions as a percentage of listings are on the rise:

Existing homes’ median sold prices are chopping between 400k and the mid-300k range:

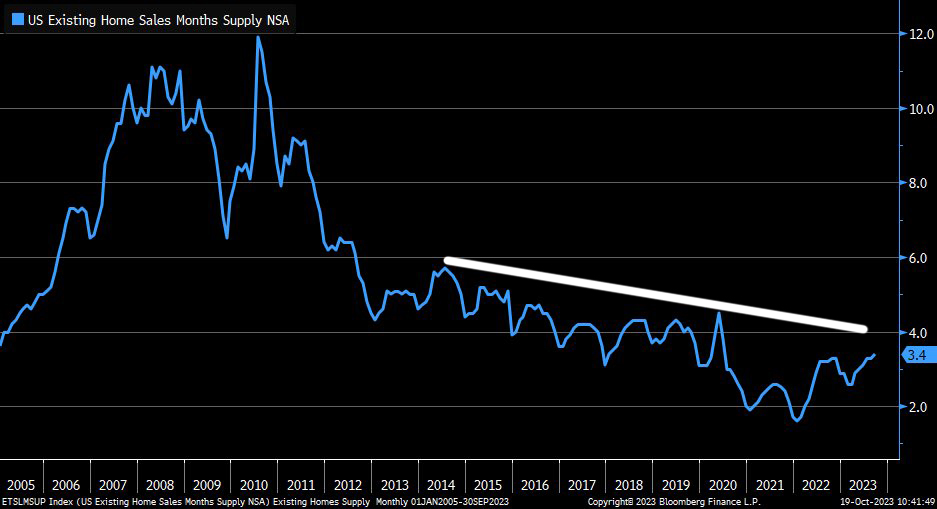
Existing homes’ inventory is slowly trending upward since 1Q22:
Existing homes’ median days on the market:

Existing home sales have collapsed to GFC and pandemic levels:


U.S. existing home sales decline broken down by region:

New Homes’ median sales price sold in September was $418,800, down 3.3% from the prior month. From a year earlier, the median sales price decreased 12.3%.
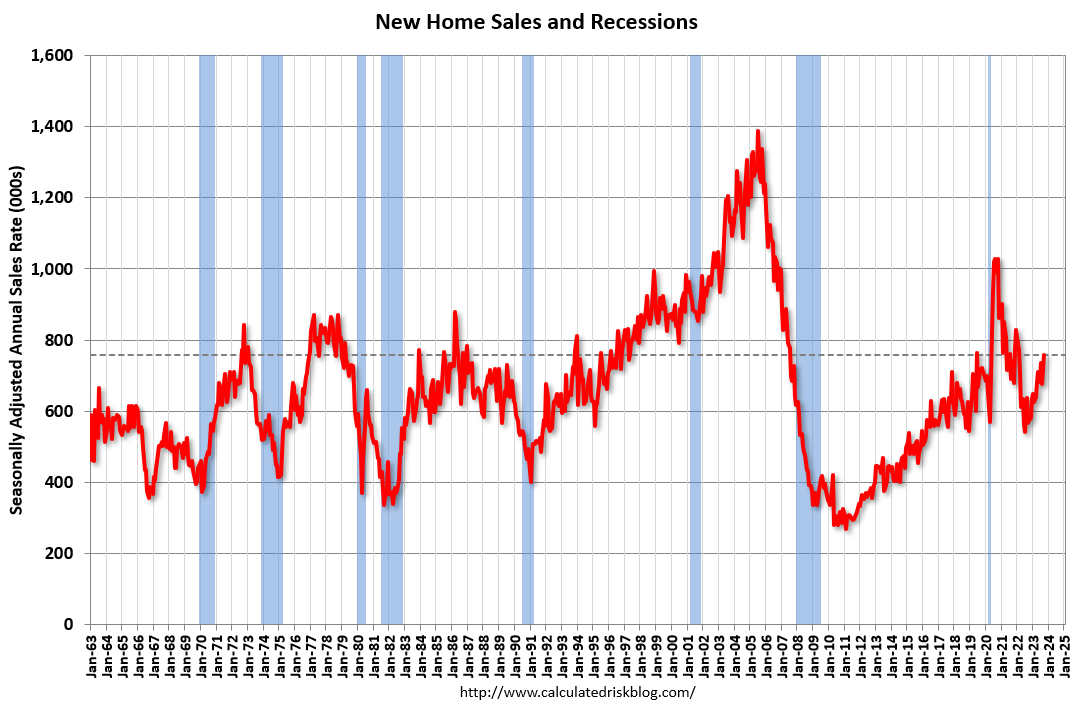
New home sales are at the 2007-2008 level after a pivot off the pandemic low:
New home inventory is rolling over to the 2007-2008 level after the pandemic spike:

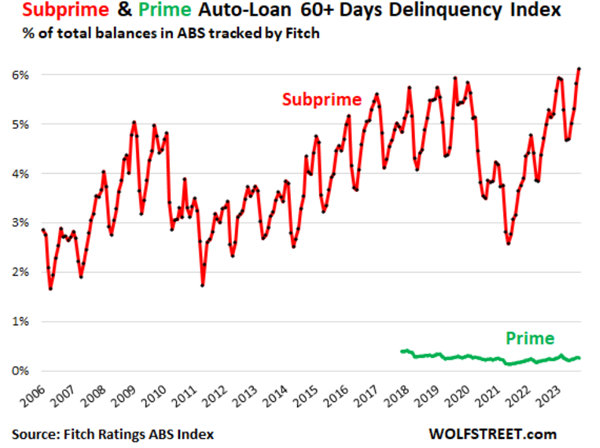
Let’s throw in the charts for delinquency rates on consumer credit card debt being at the highest level since 1992, auto loan delinquencies trending higher than the GFC and pandemic panic, and home foreclosure notices are surging:

Homeowners facing foreclosure are on the rise:
Foreclosures continue to surge: Are they a threat to the housing market?… “Is this a repeat of the 2008 housing bust? The number of homeowners hit with foreclosure notices in 3Q23 jumped 34% YoY to nearly 125,000, according to a recent report from real estate data firm ATTOM. They were up 28% from 2Q23. Across the country, about 1 in every 1,121 properties had a foreclosure filing in the third quarter. That’s a return to almost pre-pandemic levels as foreclosure moratoriums put in place in the early days of COVID-19 have expired. Filings included default notices, scheduled auctions, and bank repossessions. ‘Foreclosures are on the rise again,’ ATTOM CEO Rob Barber said in a statement. ‘It’s evident that some homeowners are still grappling with the pandemic’s financial aftermath or encountering new challenges’… Homeowners in many parts of the country that were hit hard during the foreclosure crisis of the 2000s also had higher foreclosure rates in the third quarter of this year. New Jersey had the highest rate among the states, with 1 in every 595 properties with a foreclosure filing. It was followed by South Carolina, with 1 in every 730; Delaware, with 1 in every 739; Nevada, with 1 in every 763; and Maryland, with 1 in every 780.” – New York Post, Oct. 20

If you are looking to buy over the next year, keep a close eye on existing home inventory for a signal that a decline in home prices is likely to accelerate. A good indicator is when it breaches the topside trendline I provided on the chart above. A recent Bloomberg analysis on the effect 8% mortgage rates will have on the housing market noted that “we have to become super-focused on this low inventory, this low supply environment, because a growth in supply for any reason will lead to weakness in home prices.”
Doggonit – Oliver Anthony
Plan Your Trade, Trade Your Plan
Headline Collage Art by TraderStef

Not a Financial Advisor: None of the content produced by TraderStef™, staff members, or any services associated with this website should be construed as financial or investment advice. Financial investment is a risky endeavor and may lead to substantial loss. Always perform due diligence before undertaking any financial decision – Copyrighted Material: A “by TraderStef” credit linked back to this website is required when using any quotes, technical analysis charts, or publishing a partial version of an article.


One thought on “Bubble, Bubble, Housing Market Toil and Trouble: Capitulation”
Comments are closed.