

Originally published Apr. 6, 2024 by TraderStef on CrushTheStreet
Reasoning for the current rally in gold and silver finally catching up is multi-faceted but primarily driven by worldwide fiscal crises while on the precipice of WW3 escalation with peaceful diplomacy nowhere in sight. Legacy media is clearly out of touch with no relevant analyses on matters concerning the precious metals because their headlines are infiltrated by multiple fifth-generation warfare (5GW) issues and enticing dreamers to gamble on billion-dollar lottery jackpots with ridiculous odds of losing. An excellent intel roundtable that was recorded yesterday is at the bottom of the page.
“The mainstream media has finally noticed gold, but has no idea why it’s rising, or has any appreciation for how high it’s going. They’re also not encouraging anyone to buy it. All of this is a good sign that the rally still has a long way to go before any meaningful correction.” – Peter Schiff, Apr. 3
Here’s a prescient excerpt from my late spring analyses (Twitter thread):
“A flood of geopolitical factors and economic data began to coalesce during the first week of March, which built a Swiss Stair pattern on gold’s hourly chart that’s indicative of institutional accumulation… The most explosive outcomes occur during an extended ‘primary bull’ consolidative phase that challenges a strong resistance level before entering blue-sky territory, and then a lengthy intermediate stage of consolidation exhausts and attempts to decisively enter or return to a ‘secular bull’ trend. The price of paper gold extended into blue-sky terrain this month and there is one final test that remains. A comprehensive example of the process has been clear on gold’s chart since the 1999 low with a primary phase during the Dotcom bubble fallout, a secular rally following 9/11 and the Great Financial Crisis that peaked at $1,921 in Sep. 2011, and then a new primary consolidation that challenged the $2,075 resistance zone since Aug. 2020. Seasoned traders prefer a Throwback in price that confirms former resistance as solid support before committing extensive capital.” – TraderStef, Mar. 16
If Iran’s proxy war against Israel and/or NATO’s proxy war against Russia in Ukraine escalate in the near-term, it is possible that a seasonal price correction that typically occurs in the spring may not happen this year.
Below is today’s technical analysis for gold’s monthly and silver’s weekly charts. A monthly chart provides a window for one or two months going forward, and a weekly one covers the potential price movement for a few weeks. Rips and dips in the dollar and breaking news events combined with the dominance of automated trading decisions, HFT platforms, and artificial intelligence radically influence price action across all financial markets in either direction at all times within microseconds and cause bouts of extreme volatility. Be mindful that a window of opportunity for swing or scalp trading precious metal ETFs, spot, options, futures, or mining stocks does not necessarily equate to timing for layering core long-term positions or purchasing physical bullion and coins. To view a larger version of any chart below, mouse over it and select or right-click and choose a “view image” option.
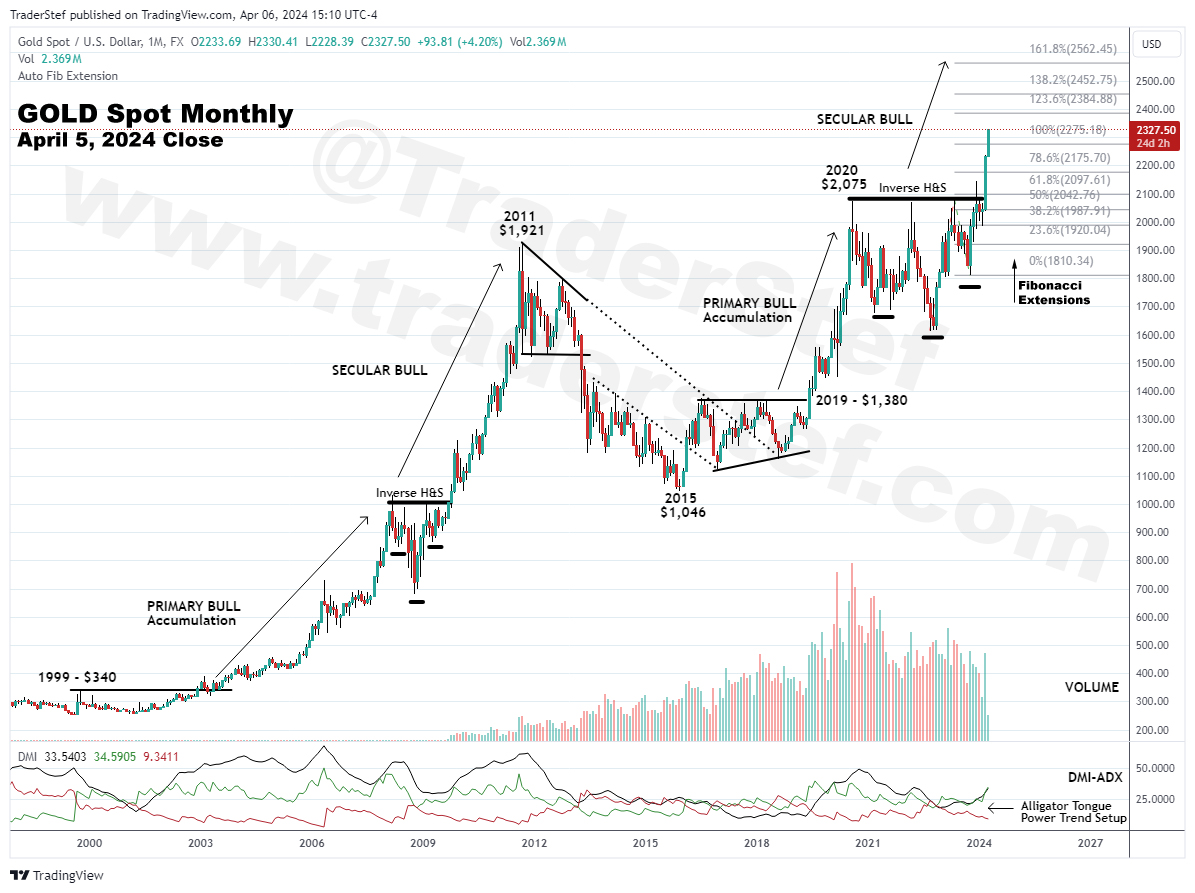
Gold Spot monthly chart as of Apr. 5, 2024 close…
Excerpt from the Feb. 29, 2024 (thread) weekly gold chart analysis:
“An expected, consolidation is playing out with the price closing above the 23.6% Fibonacci level and $1,980 support that was resistance in the past. The choppy price action has gone on to form a bullish Half Staff Flag following the 1-hour spike to $2,145 on Dec. 3. The candlestick bodies remain firmly above all Exponential Moving Averages (EMAs) that assist in keeping the uptrend intact. Major resistance is at $2,100 around the Inverse Head & Shoulders Continuation pattern’s Neckline, and then a minor battle to the $2,145 all-time high. Support rests at $1,980, the 50 EMA, and around $1,940 at the 38.2% Fibonacci level. Gold printed $2,044 at today’s close in New York… Volume is paltry and must improve significantly for any breakout into the all-time high zone to establish new highs in blue-sky territory. The chart is bullish (March 1 update: gold spot closed at $2,083).”
Excerpt from the Mar. 15, 2024 (Twitter thread) weekly gold chart analysis:
“The gold spot hourly chart posted on my Twitter feed on Mar. 5 shows where a Swiss Stair formation occurred and is indicative of institutional accumulation at the rally’s onset in the first week of March… At Friday’s Mar. 15 close, the price action was taking a breather within a Symmetrical Triangle. On the weekly chart, note that the $2,195 high on Mar. 8 was within $5 of the $2,191 Fibonacci Extension level drawn on the weekly chart published on Jul. 31, 2020. Utilizing Fibonacci is a tried-and-true method for populating a blue-sky condition that’s void of price history, which is essential to identify price level targets over the horizon… The Half Staff Flag noted on Feb. 29 was confirmed as bullish last week when the price decisively spiked through its topside trendline and the Inverse Head & Shoulder’s Neckline. Now we wait and see if the current retreat in price is a Throwback that tests the Neckline’s $2,100’ish as a solid level of support. Friday closed at $2,155.67. The weekly’s DMI-ADX is at the early stage of a bullish Alligator Tongue setup, the StochRSI topped out and mirrors the Throwback, Money Flow and Momentum are struggling to rise, the Commodity Channel Index (CCI) tapped the overbought zone, all the moving averages remain lined up perfectly, and buy Volume increased for two weeks but printed lower this past week. Again, price follows Volume, and levels that are at least close to previous bars during rallies are needed to confirm this rally has serious legs for the near-term. The chart is bullish with a Throwback in-play.”
Gold is certainly having its day in the sun while spring settles into North America. The price action has decisively spiked through the resistance zone in the $2,070s since late March, exited the primary consolidation phase that lasted a decade, and returned to a secular bull market in late March and early April. There is no benefit in slicing and dicing candlesticks within shortened timeframes right now. An updated monthly chart since gold’s 1999 low is in order. We are in deep blue-sky territory with powerful momentum and expect breathtaking rips and dips along the way. I have included the latest Fibonacci Extension levels on the chart that will eventually become support and resistance stages going forward.
The DMI-ADX has secured an Alligator Tongue power trend setup. Last month’s buy Volume was solid, and April could match or possibly exceed March. There are overbought signals in shorter timeframes, but it will likely produce shallow pullbacks, and momentum players will ladder long positions at every dip. This explosive rally will only slow after exhaustion. There is no candlestick history or any analyst that can provide anyone with a definitive roadmap. Fibonacci and basic chart reading skills are all there are and a fun sandbox for seasoned traders. Friday closed at $2,327.50 and the chart is still bullish.
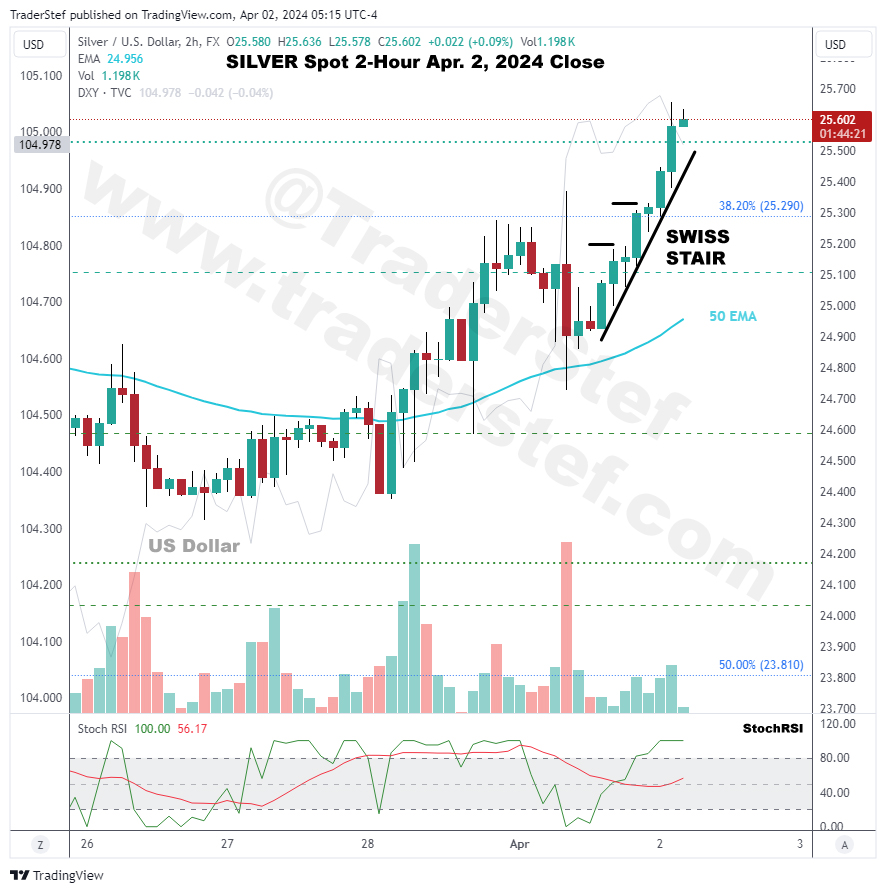
Silver Spot 2-hour chart as of Apr. 2, 2024 close…
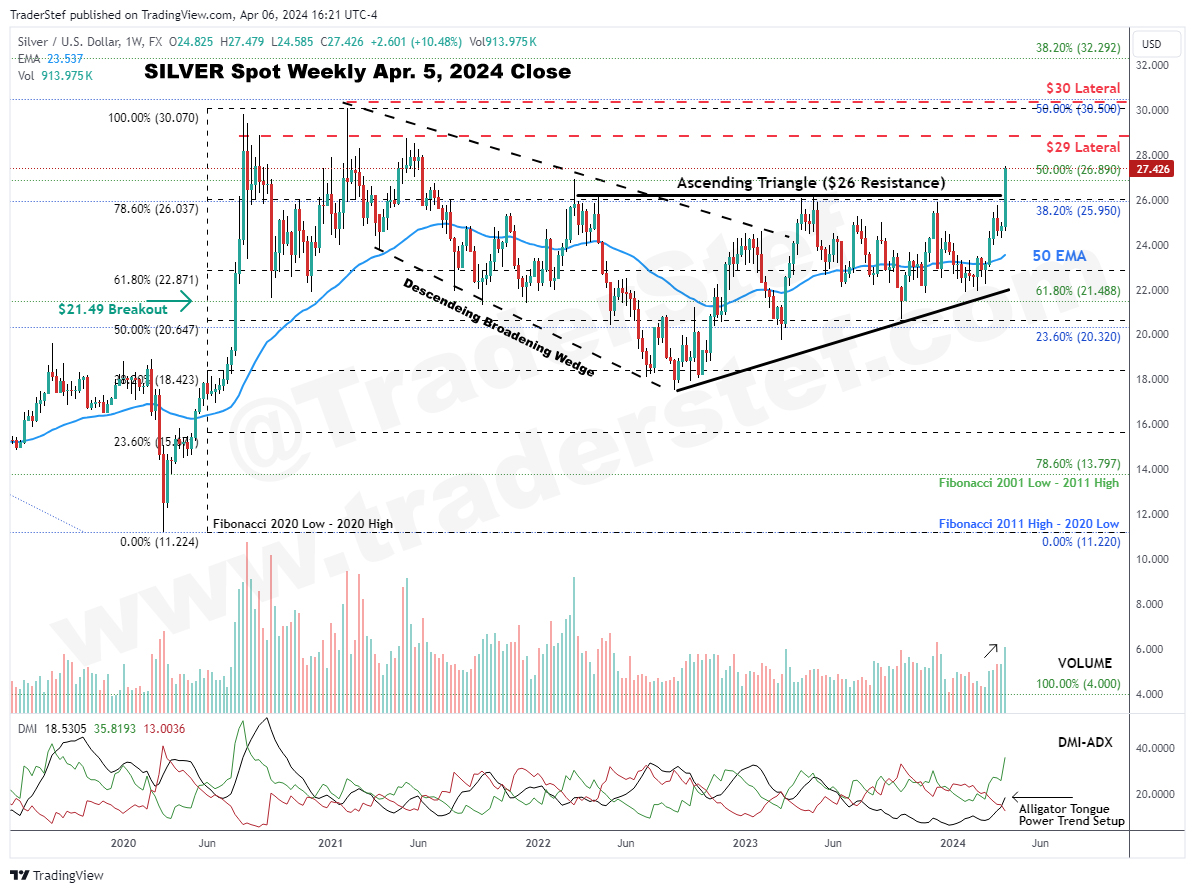
Silver Spot weekly chart as of Apr. 5, 2024 close…
Excerpt from the Feb. 29, 2024 (thread) weekly silver chart analysis:
“Silver has been the status quo since mid-December and in a tight consolidation with consistent closes above the 150 EMA while wrapping around the EMAs above it and the 38.2% Fibonacci slicing through the center… The dominant pattern in play is an Ascending Triangle drawn back to the highs in early 2022. Current resistance is between $23 and $24 with support resting at the 150 EMA, the lower trendline of the Ascending Triangle around $22, and the 200 EMA near $21.50. Silver printed $22.65 at today’s close in New York… A significant uptick in buy Volume is required to retest $26 and have a shot at the $29 and $30 resistance. The chart is neutral but has continued printing higher lows since last August (March 1 update: silver spot closed at $23.24).”
Excerpt from the Mar. 15, 2024 (thread) weekly gold chart analysis:
“The silver spot hourly chart is nearly a mirror of gold’s hourly except that silver’s price action headed higher following a Half Staff Flag vs. gold trending sideways within a Symmetrical Triangle. On the weekly chart, silver has still been consolidating since early 2022 with higher lows within an Ascending Triangle. Solid resistance is at the 23.6% Fibonacci and $26. Keep in mind that gold can drag silver upward but is fighting a recessionary downtrend in price that’s been plaguing many commodities since mid-summer 2022. Roughly 50% of silver demand is for industrial use, not monetary. The current rally spiked through the EMAs and printed a high of $25.43 last week with Friday closing at $25.18. The weekly’s DMI-ADX is unremarkable without a bullish Alligator Tongue setup, StochRSI is partially overbought, Money Flow and Momentum are struggling to rise, the Commodity Channel Index (CCI) is in the overbought zone, and all the moving averages remain lined up nicely, but buy Volume has not increased. Again, Volume levels that are at least close to previous bars during solid rallies are needed to decisively breach $26 and challenge the $29 and $30 resistance. The price action is procrastinating but bullish.”
Silver’s breakout above the Ascending Triangle’s topside trendline at $26 on Apr. 2 was significant. This rally was fueled by a Swiss Stair (noted in Twitter thread, but the 2-hour chart above was not published) pattern that began its buildout on Apr. 1, which resulted in a hefty gain just shy of $3 with Friday’s high at $27.48. There is minimal resistance from here until challenging $29 and $30. Do not be surprised if a Throwback occurs first to test $26 as solid support. Silver remains in a primary bull accumulation/consolidation phase and will not return to a secular bull run until $50 is decisively taken out.
The DMI-ADX rapidly formed an Alligator Tongue power trend setup along with improved buy Volume that’s rising since mid-March. Every dip opportunity over the last two weeks was eagerly bought by momentum players. Time is rapidly running out for laddering core positions below $30 if this rally continues unabated. Friday closed at $27.43 and the chart is bullish.
INTEL Roundtable w/ Larry Johnson & Ray McGovern: Is/Was WWIII Pre-Planned? – Judge Napolitano, Apr. 5
Plan Your Trade, Trade Your Plan
Headline Collage Art by TraderStef – Screenshot From “Paper Moon” (1973)

Not a Financial Advisor: None of the content produced by TraderStef™, staff members, or any services associated with this website should be construed as financial or investment advice. Financial investment is a risky endeavor and may lead to substantial loss. Always perform due diligence before undertaking any financial decision – Copyrighted Material: A “by TraderStef” credit linked back to this website is required when using any quotes, technical analysis charts, or publishing a partial version of an article.


3 thoughts on “Gold and Silver Outlook for Spring 2024 – Technical Analysis”
Comments are closed.