

Below is a sample of my bitcoin technical analysis charts and articles beginning in November 2015. At that time, bitcoin experienced a breakout from its primary bull into a secular bull run through to December 2017. Twitter screen shot dates are linked out to my Twitter feed. To view a larger version of any standalone chart, right-click on it and choose your “view image” option.
*Final post & chart in this Bitcoin TA project is #40 – May 2021*
1) November 2, 2015 – Bitcoin weekly chart… The original chart…

————
2) November 4, 2015 – “Bitcoin weekly chart this morning, looking like a #RYPO move on the Daily today, $470’s this morning, China baby.”

————

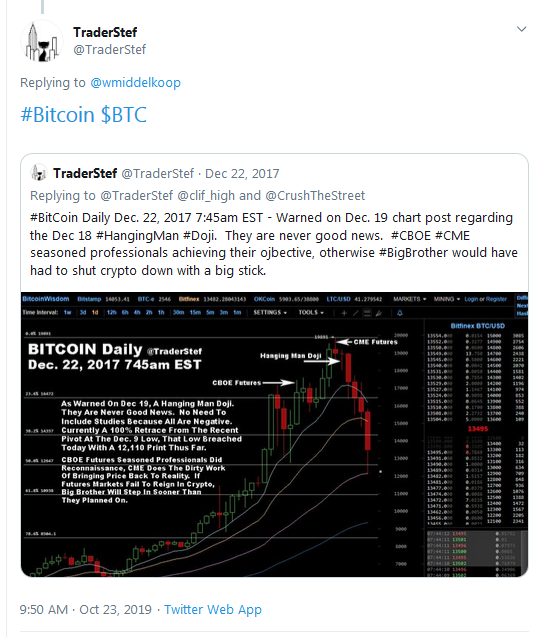
3) December 22, 2017 7:45am EST – “Bitcoin Daily chart, warned on Dec. 19 chart post regarding the Dec. 18 Hanging Man Doji. They are never good news. CBOE CME seasoned professionals achieving their ojbective, otherwise Big Brother would have had to shut crypto down with a big stick.”

Bottom caller & bear market denier #1 in February…
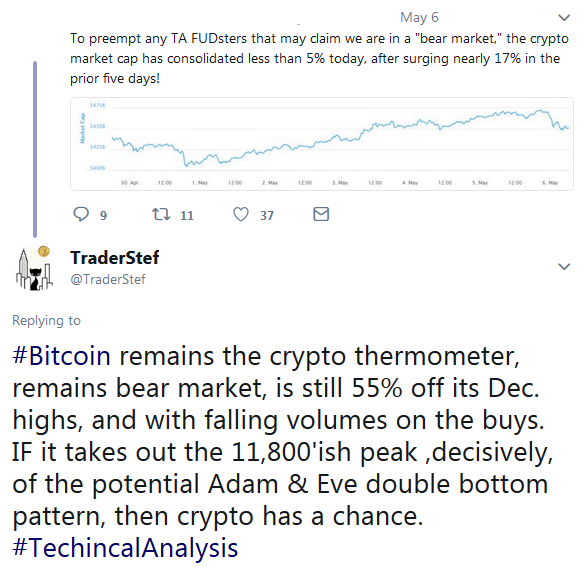
Bottom caller & bear market denier #2 in April …

————
4) April 20, 2018 10:15am EDT – “Potential Adam & Eve Double Bottom pattern with a $500 spread. $11,800 must be taken out decisively for any breakout confirm. Armchair bottom callers foolishness abound. Resistance at 50 & 200 EMA Death Cross , volumes weakening.”

————
Bottom caller & bear market denier #3 in May…
5) May 24 (article) – The Bitcoin Crypto-Coaster Ride – Technical Analysis… “There will be no financial press, fundamentals, cryptophant community opinions, or geopolitical fodder provided here today, but only basic technical analysis. Why now?…”

————
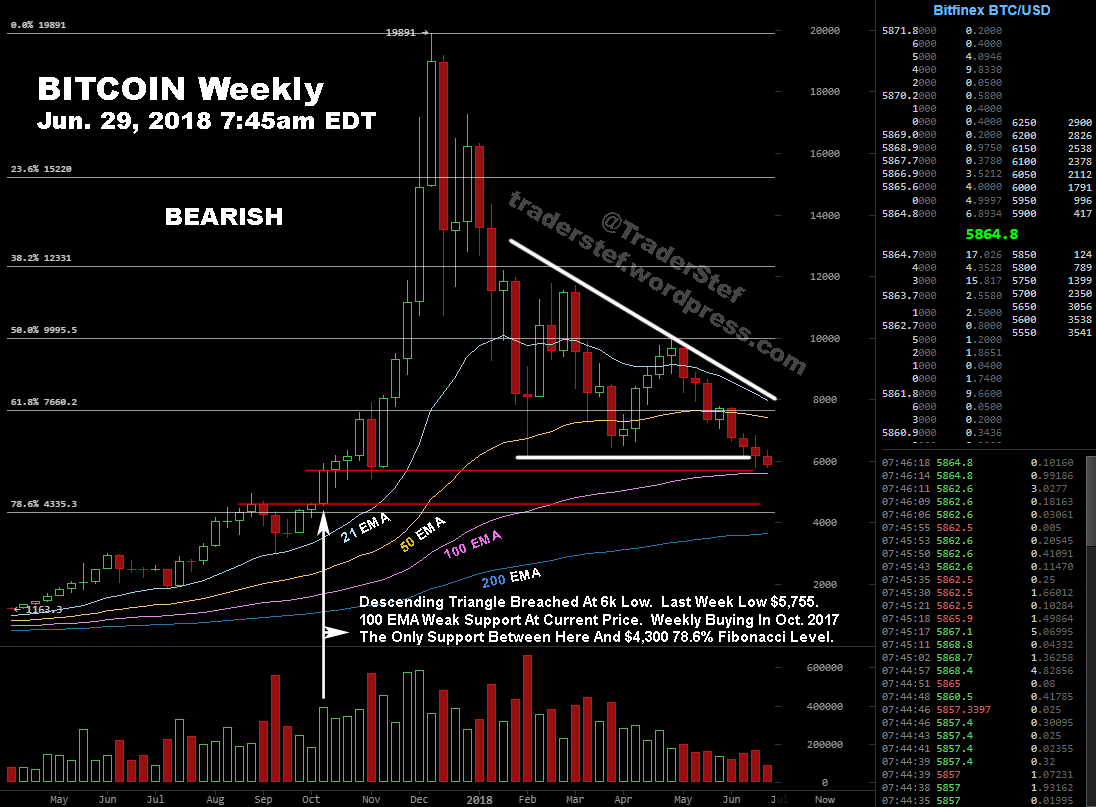
6) June 29, 2018 7:45am EDT – “Bitcoin Weekly, Descending Triangle breached at 6k low last week. Low $5,755. 100 EMA weak support at current price. Weekly buying in Oct. 2017 is the only support between here and $4,300 78.6% Fibonacci level.”
————
7) August. 4, 2018 8am EDT – “Nothing has changed since early Jun. 2018. Bearish Descending Triangle and the 50 / 200 EMA Death Cross (on Daily chart) remains in play.”

Bottom caller & bear market denier #2, again in September…

8) Goldman Sachs kills crypto trading desk plans, Bitcoin flash crashes…
9) September 16, 2018 6:30am EDT – Bottom callers and bear market deniers suckered in due to unqualified short squeeze call-outs on September 2, 2018…

10) Bitcoin Daily Chart November 14, 2018 11am EST.

11) Nov. 24, 2018 (article) – The Bitcoin Crypto-Coaster Ride – Technical Analysis Part 2 …”Severe technical damage has occurred with a potential for further downside. This is not a time to catch a falling knife and be a gambling hero”…

12) Dec. 5, 2018 – Bitcoin Daily Chart 12pm EST – the plunger candle, then three waves down, a fourth wave on momentum coming?

13) Dec. 7, 2018 – Bitcoin $BTC Daily, 8am EST – as called on Dec. 5, a fourth wave down on momentum.

14) Dec. 17, 2018 – The fourth wave down printed a $3,215 low on Dec. 14 via Bitfinex. There is the potential for a capitulatory 5th wave down. Also, take note of the following article published this morning…
One of the first crypto millionaires says bitcoin is ‘dead’… “When it comes to investor bitcoin burnout, it takes one to know one. Erik Finman, who gained renown after becoming one of the earliest crypto millionaires, told MarketWatch in an interview that the virtual currency that made him wealthy is headed to the trash bin. “Bitcoin is dead, it’s too fragmented, there’s tons of infighting. I just don’t think it will last.” – NYPost, Dec. 17
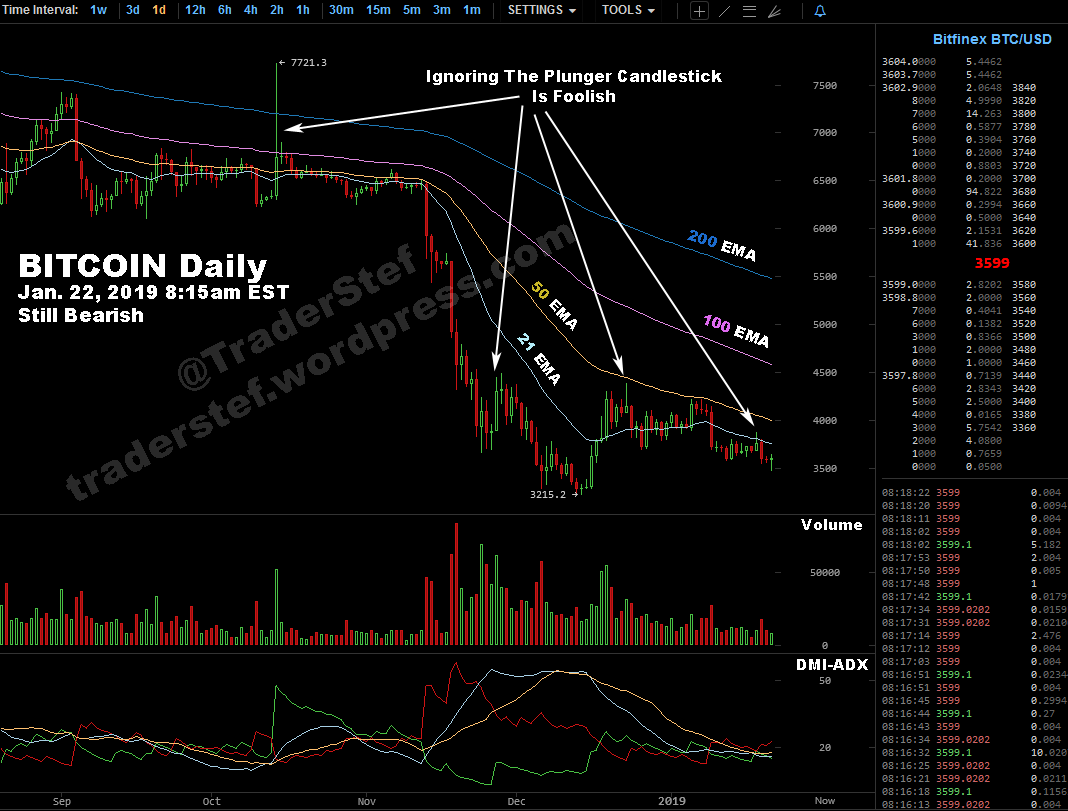
15) Jan. 22, 2019 8:15am – Ignoring plunger candlesticks is foolish – the chart remains bearish and requires many many thousands of $ to the upside to even show a hint of bullish… Jan. 25: JPMorgan: Bitcoin Is Worth Less Than the Cost to Mine It
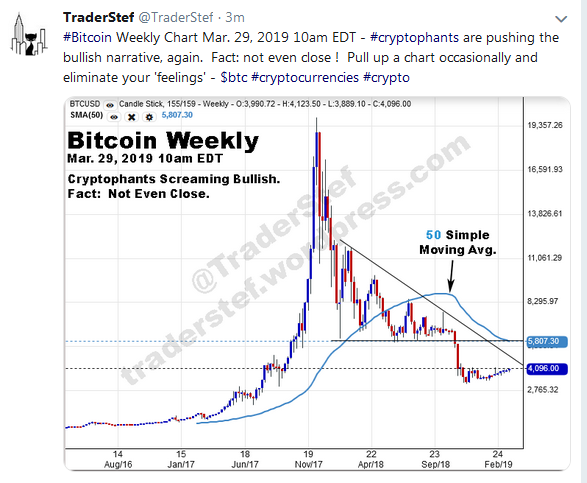
16) Mar. 29, 2019 10am EDT – Bitcoin Weekly Chart – cryptophants are pushing the bullish narrative, again. Fact: not even close ! Pull up a chart occasionally and eliminate your ‘feelings’ – $btc cryptocurrencies crypto.
17) Apr. 28, 2019 – Tom Lee, who in May 2018 tried to sell you $25,000 $BTC by end of 2018, then in Dec. 2018, he complained on Bloomberg that the “markets are wrong” when it did not happen.
I have news for Tom. The markets and charts are always right, your entry and exits are wrong, and your emotions have no business in this business. Now he says the “crypto-winter” is over. I have more news for Tom. The bitcoin chart remains in a bear market as of today, and thousands of $ to go through overhead resistance before anyone can claim a new bull has begun.
18) May 10, 2019 – “The Bitcoin Crypto-Coaster Ride – Technical Analysis” Part 3

19) May 18 – Recommended reading for savvies from @RoryTDC published on May 15 at TheDailyCoin.org “Here We Go Again… Bitcoin Was, Is and Always Will Be A Tool Created by the NSA and MIT”.

20) May 20 – “The Biggest Fraud in History” – Jim Rickards at the DailyReckoning…

21) May. 29, 2019 8:20pm EDT – Bitcoin Daily Chart – “heads-up, caution is warranted here for some downside price action near-term.”

22) June 9, 2019 7am EDT – Bitcoin Daily Chart – “May 29, Triple Doji Top warning for downside price action confirmed. Two Plunger Candles followed, buy Volume falling, sell Volume remains elevated, StochRSI rolling over, DMI-ADX negative.”

23) June 11, 2019 10am EDT – Bitcoin 30-minute Chart – “May 29 Triple Doji Top heads-up… June 9 confirmed… today a Head & Shoulders pattern completing which tilts the odds to more downside price action.”

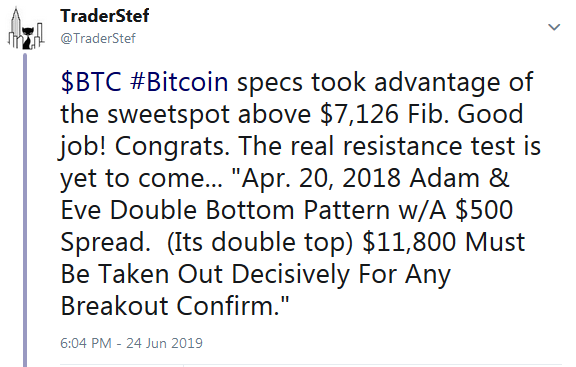
24) June 24, 2019 – $BTC Bitcoin specs took advantage of the sweetspot above $7,126 Fib. Good job! Congrats. The real resistance test is yet to come… “Apr. 20, 2018 Adam & Eve Double Bottom Pattern w/A $500 Spread. (Its double top) $11,800 Must Be Taken Out Decisively For Any Breakout Confirm.”
25) The Anatomy Of A Fake Cryptocurrency Trade: How Exchanges Create Phony Transactions – Forbes Magazine, July 2, 2019
26) August 11, 2019 4:10am EDT – Repeatedly noted $11,800 (is now $11,600 due to plunge to $3,121 low, which reset the Fibonacci $ levels) as an important resistance level ever since, due to its significance as a first Dead Cat Bounce and subsequent Double Top, off of the $3,121 pivot low following the first plunge down from Dec. 2017 high #Bitcoin $BTC #TechnicalAnalysis #Fibonacci 
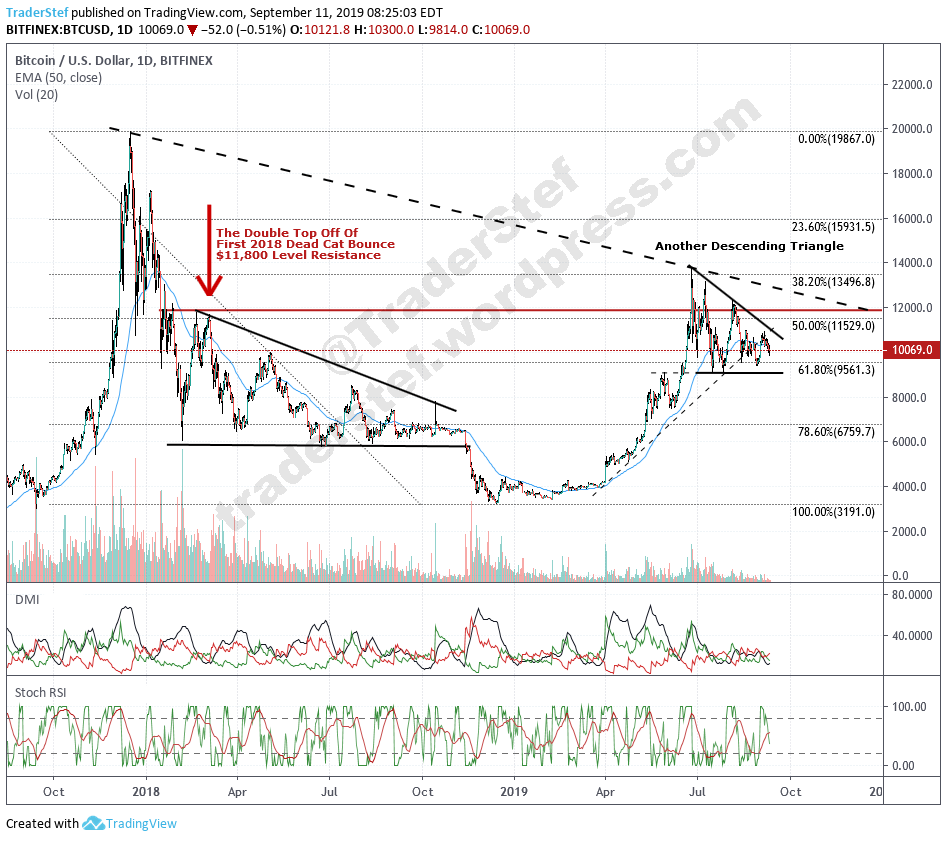
27) September 11, 2019 8:25am EDT… there are absolutely no technical analysis indicators or pattern on the daily chart that are bullish at this time. Speculate at your own risk.
28) Sep. 25, 2019…
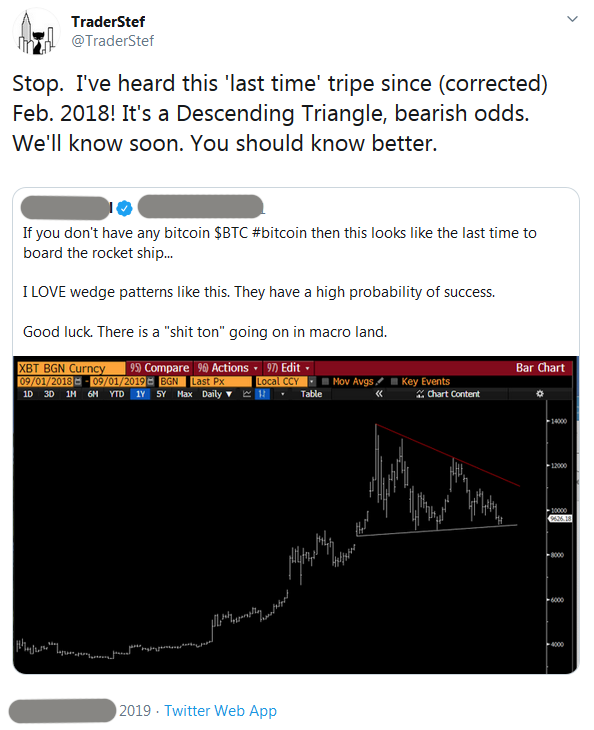

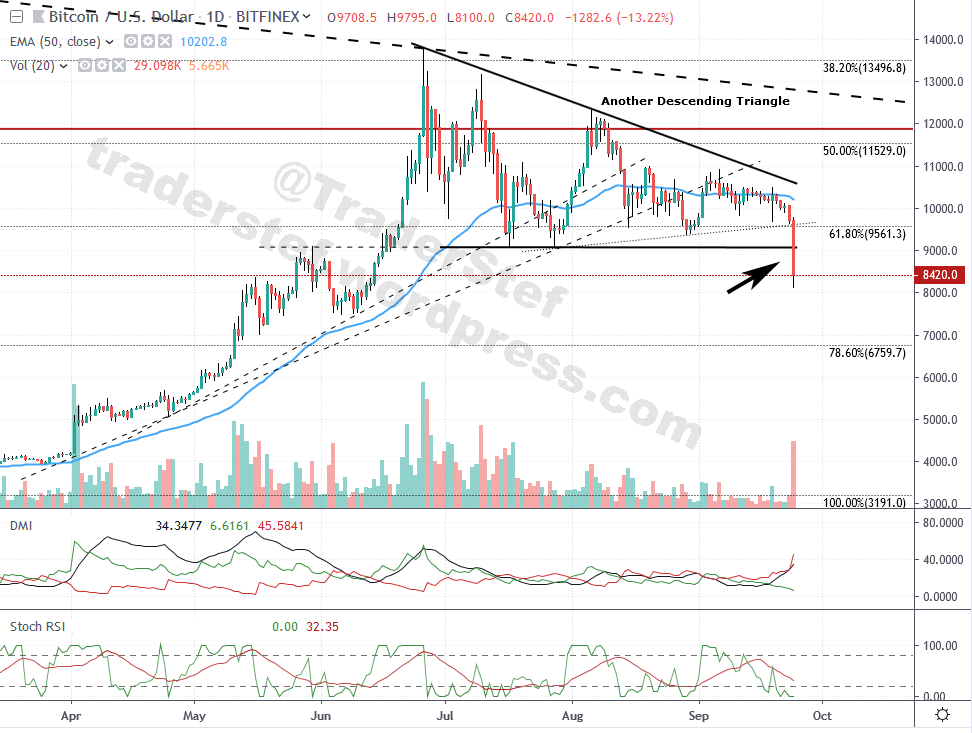
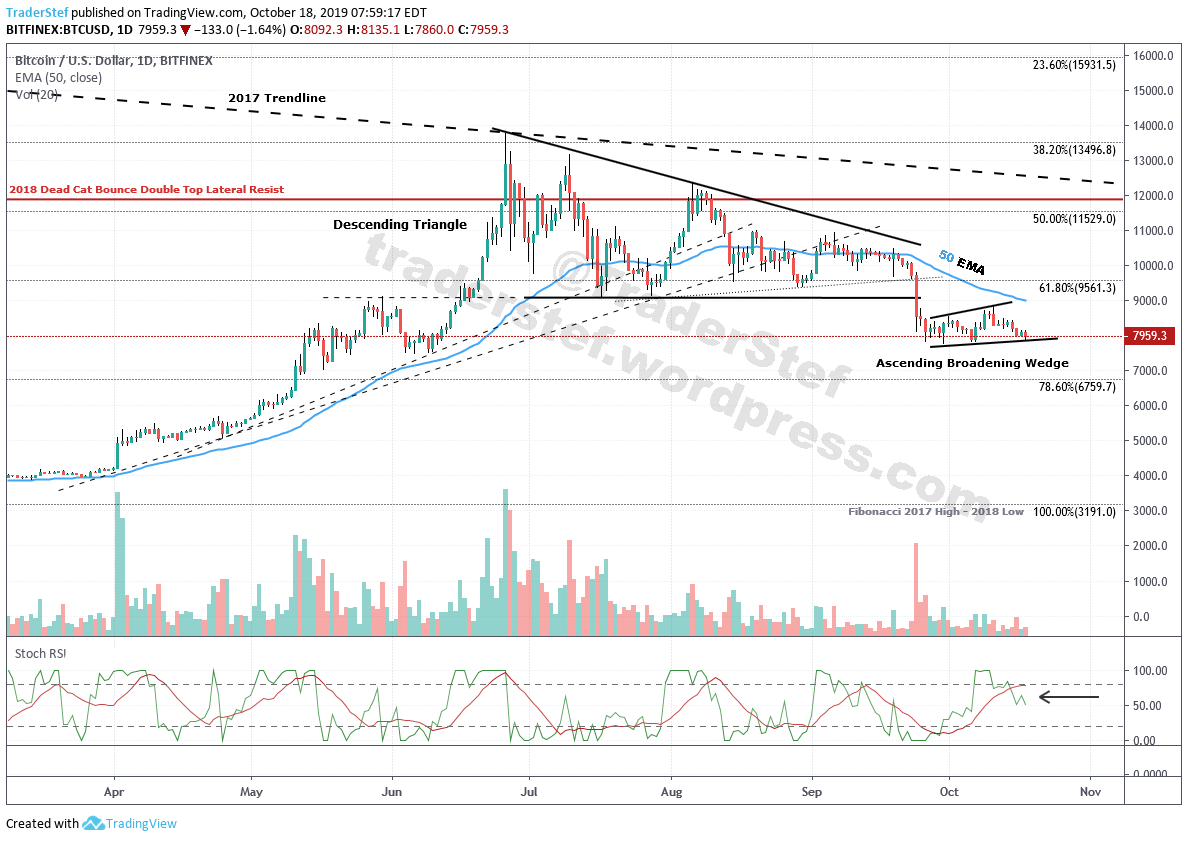
29) October 18, 2019 8am EDT – Bitcoin BTC Daily Chart… Ascending Broadening Wedge is bearish, odds lean to more downside price action.
30) October 23, 2019 9am EDT – Bitcoin BTC Daily Chart… Bearish pattern called out on Oct. 18, confirmed today with a breakdown.

31) A warning I gave nearly 2 years ago, concerning the CME Futures impact on Bitcoin, and is confirmed today in an article – back in Dec. 2017 when Futures contracts were launched, just prior to Bitcoin’s all time high, savvies were warned via Technical Analysis that a bust was coming, and it began within one week…

 ___________________

Referenced video – E-trade baby loses everything:
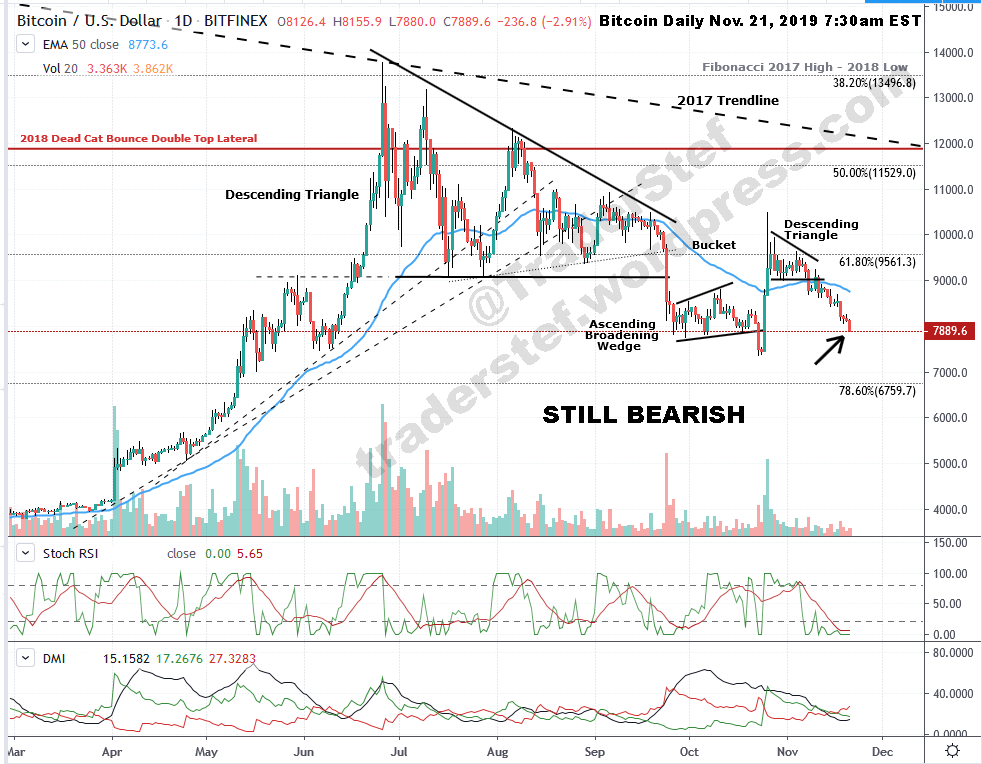
32) As I add this update on Nov. 24, 12pm EST, the low print thus far is $6,736 and sitting on the 78.6% Fibonacci. The chart remains bearish…
November 21, 2019 7:30am EST... STILL BEARISH Daily Chart:
33) Bitcon Daily Chart Mar. 9, 2020 8:40am EDT... Crypto cryptophants warned numerous times based solely on the chart. I don’t read $BTC business and don’t have to. The trend remains BEARISH with speculative machine scalping in a speculative vehicle. If I see a Bull, you’ll know.

34) Bitcoin Is Still Failing As A Flight To Safety Investment… “Yet again, bitcoin bulls arguing that the popular cryptocurrency is a flight to safety investment during times of stock market weakness have gotten some discouraging feedback during the coronavirus-driven market sell-off. The S&P 500 has experienced one of its sharpest drops in history in the past month, but bitcoin has performed even worse during that time.” – Benzinga, Feb. 2020
35) Bitcoin Weekly Chart Aug. 11, 2020 1pm EST: $BTC crypto cryptocurrency specs… No change at this point. The topside 12K area is still resistance since 2017 high – 2018 dead cat bounce and not decisively breached nor closed above.

36) Twitter Post: November 18, 2020 2:30pm EST… “My technical analysis on $BTC Bitcoin was consistent for 2.5yrs. Not until 12k 2018 dead cat bounce-double top lateral was taken out decisively, would 20k be possible. Today’s 18.5k high is more overbought & w/much less volume, since June 2016. Sell on strength! Profit is good.”
37) Twitter Post: November 26, 2020 7:20am EST… “A $3,000 -15% plunge in Bitcoin within 24hrs of the last warning given Nov. 25 to wisely take some profits, but cryptophants will still claim that Technical Analysis does not apply to $BTC crypto cryptocurrencies after years of dropping the knowledge with charts.”

38) Jan. 15, 2021 – “The Bitcoin Crypto-Coaster Ride – Technical Analysis” Part 4

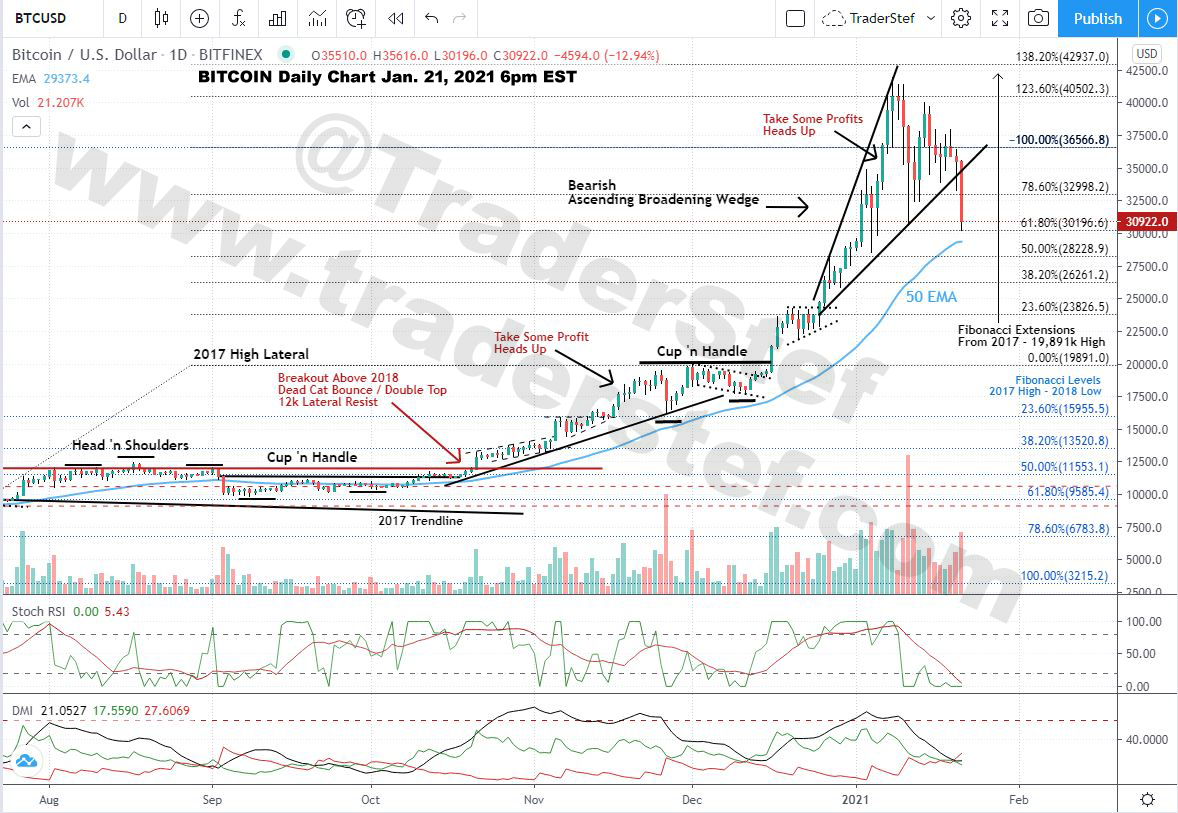
39) Jan. 21, 2021 – Bitcoin Daily Chart as of Jan. 21, 2021 6pm EST… breakdown away from bearish Ascending Broadening Wedge confirmed. See my Technical Analysis in post #38 above. $BTC Crypto Cryptocurrency.
40) FINAL POST: May 2021 – This Bitcoin Technical Analysis project has come to an end. Bitcoin is trading at 57k as I type this.
I provided a heads up at the first major breakout in 2015 that lead to the Dec. 2017 high of 20k. I also provided guidance on the way down to 3k and through the subsequent chop/consolidation up to the 12k breakout, then intermittent profit taking opportunities up to the 50k level. Beginning in March of 2018, I repeatedly emphasized on Twitter, in articles, and interviews the importance of the $11,800/12k level as thee breakout level to watch and put speculative capital to work. The decisive breakout from 12k happened in Oct. 2020 and resulted in a tremendous bull run to 60k by Feb. 2021. I hope you benefited from my analyses and made a killing. Don’t be shy about leaving a donation with some of those profits via the PayPal tip jar on the right navigation bar. I wish the best of luck to all who followed along the way. Jim Cramer knew what time it was and when…
“CNBC’s Jim Cramer said Thursday he recently paid off a mortgage using profits from his investment in bitcoin. Cramer said he bought “a lot of bitcoin” when the world’s biggest cryptocurrency was priced at around $12,000. He said he has now sold about half of his position.” – CNBC, Apr. 15, 2021
“My last #Bitcoin #TechnicalAnalysis $BTC #Crypto chart for the #cryptophants – Daily Chart, May 19, 2021 plunge: $64,829 Apr. 14 High to May 19 $29,563 Low = 60% crash.” – TraderStef May, 19, 2021 Twitter Post…


Not a Financial Advisor: None of the content produced by TraderStef™, staff members, or any services associated with this website should be construed as financial or investment advice. Financial investment is a risky endeavor and may lead to substantial loss. Always perform due diligence before undertaking any financial decision – Copyrighted Material: A “by TraderStef” credit linked back to this website is required when using any quotes, technical analysis charts, or publishing a partial version of an article.


You must be logged in to post a comment.