

There’s a lot to cover from the technical analysis side of the gold ledger, so let us go right to the charts, then to a link garden of fundamentals, graphics, and a deep dive into an “In Gold We Trust” presentation by Ronald Stöferle. To view a larger version of any chart, right-click on it and choose your “view image” option.
The most recent article published with charts was The Big Boo on Gold on Oct. 31. Here is the final chart and commentary from that post.

“The two black dots indicate the entry and exit points of the hypothetical sweet spot trade discussed… The Shooting Star candlestick at the October high of $1,243.44 on the daily turned out to be a solid indicator for the current pullback. The downtrend so far is printing a very steep Falling Wedge, with all parameters met. Each Fibonacci and Exponential Moving Average (EMA) has acted as a brief support level along the way down, with the price currently perched on the 200 EMA all day today. A solid level of support resides at the $1,210 Fibonacci lateral level that sits atop the Bear Trap, and the volumes and candlesticks indicated by black arrows are where large short squeezes took place earlier this month that will provide support. The volumes have risen through each leg down on Monday and Tuesday, but the price stabilized today atop the 200 EMA despite the rising volume and low put in early this morning at $1,211.97. The price may still probe lower to that lateral red support line or the 300 and 500 Simple Moving Averages (SMA). The DMI-ADX is still trending with negative momentum, and the StochRSI is bouncing along oversold territory. Either the price chops out from here and rounds out a bottom for the Falling Wedge or the wedge falls a bit further and tighter. There is no candlestick pattern defined in today’s grouping that gives any indication for a price direction one way or the other. Although, the 200 EMA provided solid support all day, a Dragonfly Doji printed at the low, and on the daily chart brakes were pressed on top of the 50 EMA. Those three items lean to a rounding out of a bottom here. There are plenty of newsworthy events and strong fundamentals that could move this market on a dime over the next week. I would sit tight on the sidelines and wait patiently for another sweet spot opportunity.”
The latest BREXIT news cycle that began on Halloween eve caused a spike in the British pound and euro, and a mirrored plunge in the USD caused gold to spike and exit from its Falling Wedge. The price then chopped into a Right Angled Descending Broadening Formation. The following chart was posted on Twitter on Nov. 8.

A breakdown out of the broadening formation resulted in an Ascending Triangle bottom and the price decisively breached the topside trendline on large volume. The following charts were posted on Nov. 14 and 15.


The following chart was posted exclusively for my website subscribers on Nov. 20, with a note to “keep a close eye on the price action of gold for a potential sweet spot entry” due to a confluence of indicators. Note the Swiss Stair pattern pointed out by the black arrow.
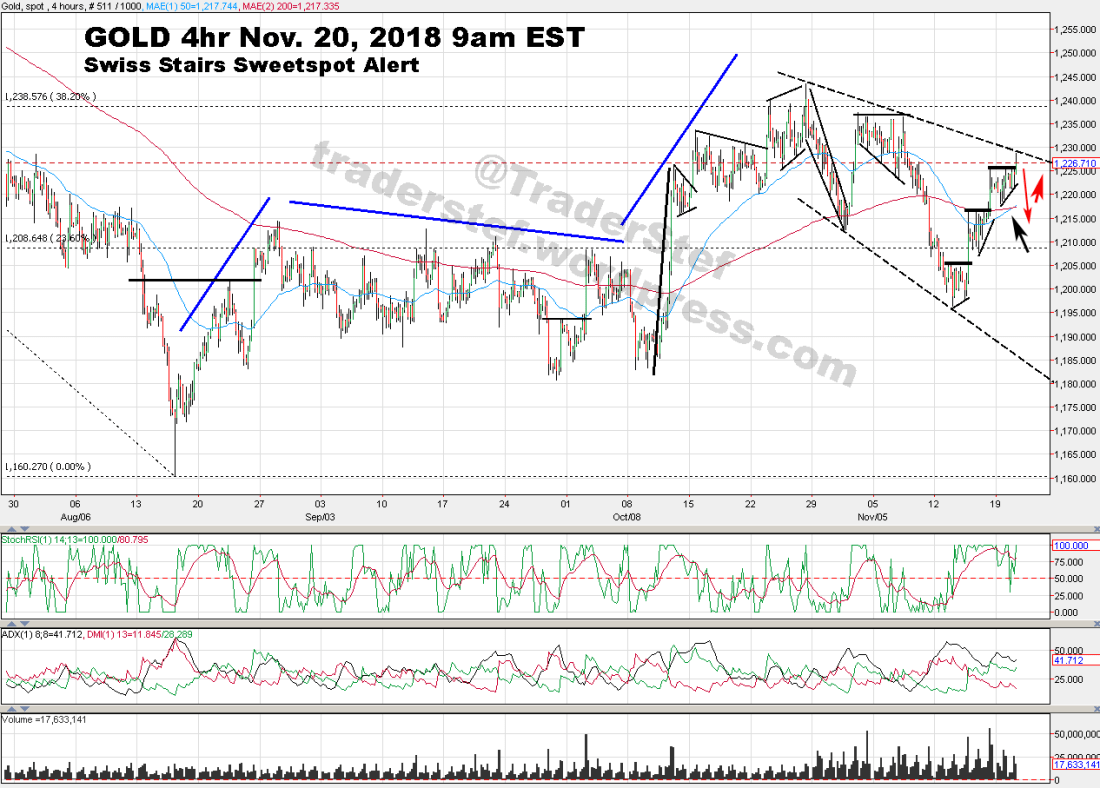
A Swiss Stair is indicative of accumulation, and the price tapped the topside trendline of a Descending Broadening Wedge. Those wedge patterns confirm to the upside when a shallow pullback occurs after the third tap topside, then a retest sets the stage for potential breakout above the trendline. I’ve annotated the chart with two red arrows to show where the price retraced to the $1,210 Fibonacci zone after Nov. 20. The Fed’s dovish turn by Powell on Nov. 28 hints at a pause in interest rate hikes for 2019 (aka the TaperCaper), which caused gold to pivot upward and close at $1,222 for the month, just shy of the Descending Broadening Wedge topside trendline sitting at $1,228 as of today’s close.
Since we are at the end of the month, let us look at the monthly chart.

Note the Simple Moving Average (SMA) for long-term time framed charts instead of Exponential Moving Average (EMA) combinations found on my shorter periods. The gold price wither of 2018 ended in August with a Hammer Candle pivot off the 2011 long-term trendline, and the price is kissing the 150 SMA on the upward trend. The price must decisively retake the 50 SMA sitting at $1,230 and the next Fibonacci at $1,250 in order to have a sustained sprint back to the $1,380 zone. What stands out on this chart is the record volume print for this month, as it is a continuation of a rising price and volume trend since August which is bullish. The price printed a bullish-leaning Northern Doji candle for the month. I am netural near-term until the Descending Broadening Wedge topside trendline on the 4-hour chart is breached decisively, then bullish near-term for a sweet spot momo play if the 50 SMA on the monthly is taken out on price and volume strength.
Here are some fundamentals and graphics to consider over the weekend.
-
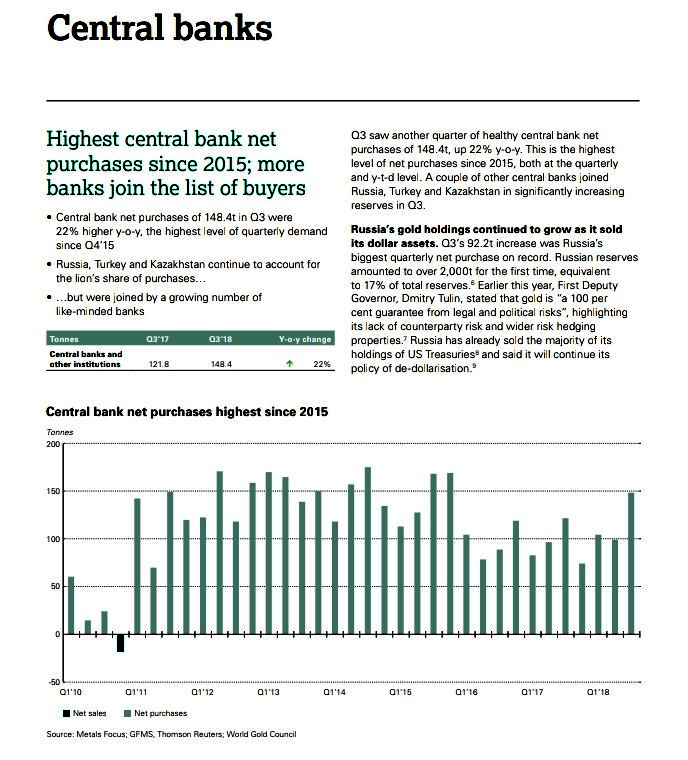
Gold Demand Trends – World Gold Council 3Q18 Report, Nov. 1

-
Hungary’s Gold Reserves Increase Tenfold, at Historic Levels – Hungary Central Bank, Oct. 17
-
Gold buying by central banks hits its highest level in almost three years – CNBC, Nov. 1
-
UK, EU close to Brexit deal on financial services – UK official – Reuters, Nov. 1
-
Barrick to revive talks w/Newmont to combine Nevada gold operations – Financial Post, Nov. 5
-
Refiner Republic Metals Files for Bankruptcy – National Jeweler, Nov. 6
-
Bank of England Refusing Venezuelan Request to Return $550 Mln in Gold – Sputnik, Nov. 7
-
Ray Dalio’s BridgeWater Faith in Gold Unshaken, Maintains GLD Stake – Bloomberg, Nov. 13
-
Pan American Silver offers $1.1 billion to buy out Tahoe – Reuters, Nov. 14
-
Worker strike forces IAMGOLD to suspend operations at Suriname mine – Mining.com, Nov. 14
-
Iran Hangs Gold Coin ‘Sultan’ in Crackdown After U.S. Sanctions – Bloomberg, Nov. 14
-
Gold Re-Monetization Is Much Closer Than Many Realize – Palisade Research, Nov. 14
-
Silver Miners All In Sustaining Cost (AISC) Higher Than Spot Price – SRSRocco, Nov. 14

-
Top Gold Miners AISC Still Provides Floor In The Market Price – SRSRocco, Nov. 24

-
Germany’s Focus-Money recommending gold – Ronnie Stoeferle at Incrementum AG, Nov. 14

-
Precious Metals highest conviction macro idea for portfolio exposure – Crescat Capital, Nov. 15
-
Morgan Stanley Says Dollar Bull Run Has Ended, Time to Sell – Bloomberg, Nov. 16
-
Goldman Predicts Commodities Will Soar in 2019 – Bloomberg TV, Nov. 26
The COMEX warehouse registered gold vs. how many ounces are under contract (Open Interest aka OI) provides us with a ratio of how many folks own each ounce of paper gold in the vaults. As of Nov. 27, OI is 442,801 x 100 ounces per contract = 44,280,100 divided by 128,452 ounces in the vault = 344:1 Ratio.


I will leave you with a presentation from the Zuri Invest Gala Dinner in November 2018 “In Gold We Trust” with Ronald Stöferle, and “Seasons of Wither” by Aerosmith.
Plan Your Trade, Trade Your Plan
TraderStef on Twitter
Website: https://traderstef.wordpress.com
Originally published on November 30, 2018 by TraderStef at CrushTheStreet.


5 thoughts on “The Wither of November – Gold Technical Analysis”
Comments are closed.