
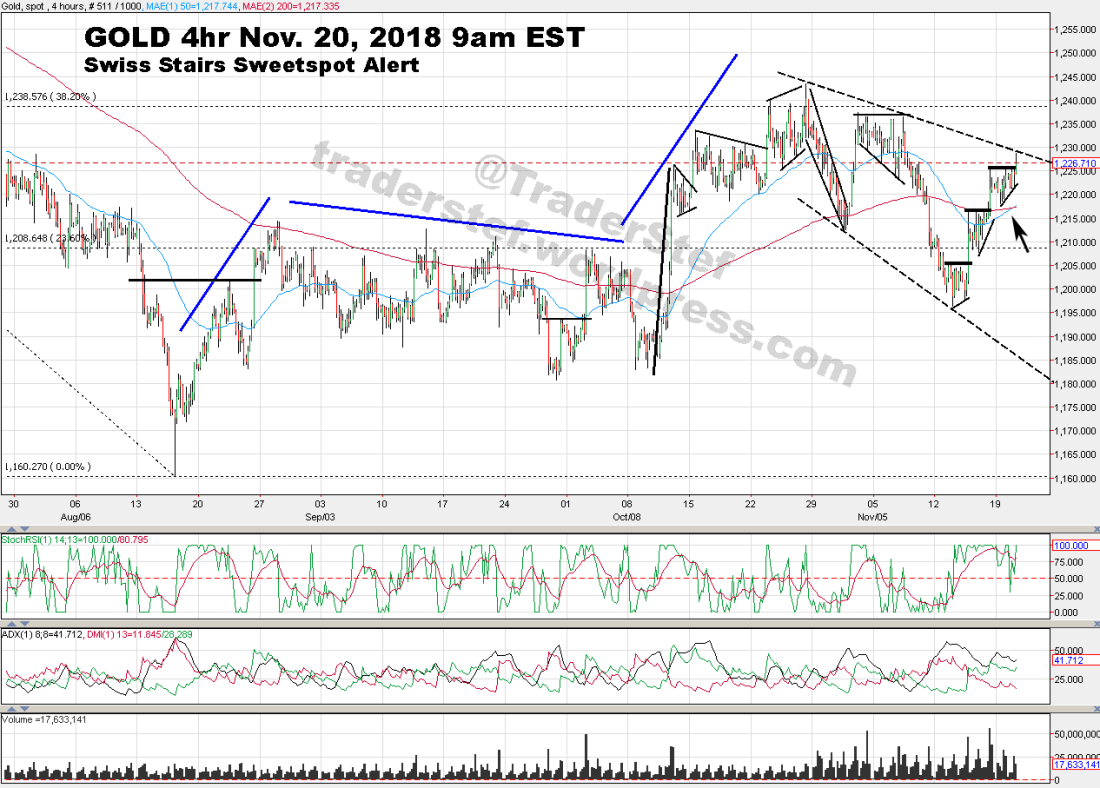
On November 20, I sent out the following sweetspot alert and chart by email to my blog subscriber base…
“Keep a close eye on the price action of gold at the current confluence of indicators. A Swiss Stair pattern is building, the 50 EMA is set to cross back over the 200 EMA for a continuation of a Golden Cross, and the dashed topside trendline is being challenged this morning. A potential sweetspot entry lurks just ahead.”
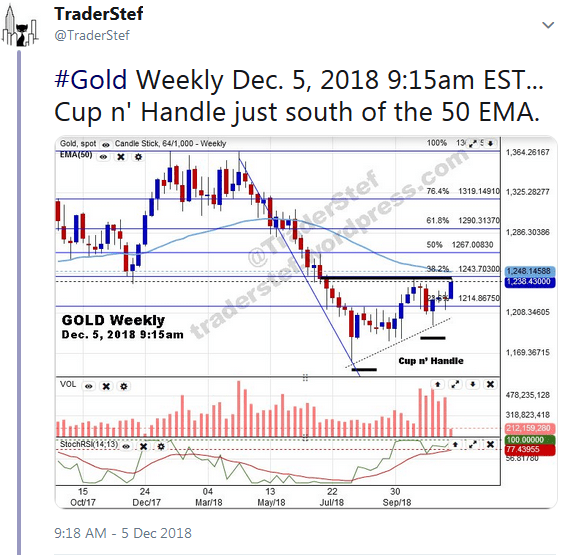
ICYM the price rise analysis since Nov. 20, it is covered in the Nov. 30 article “The Wither of November – Gold Technical Analysis,” and the following chart was posted on my Twitter feed on Dec. 5.
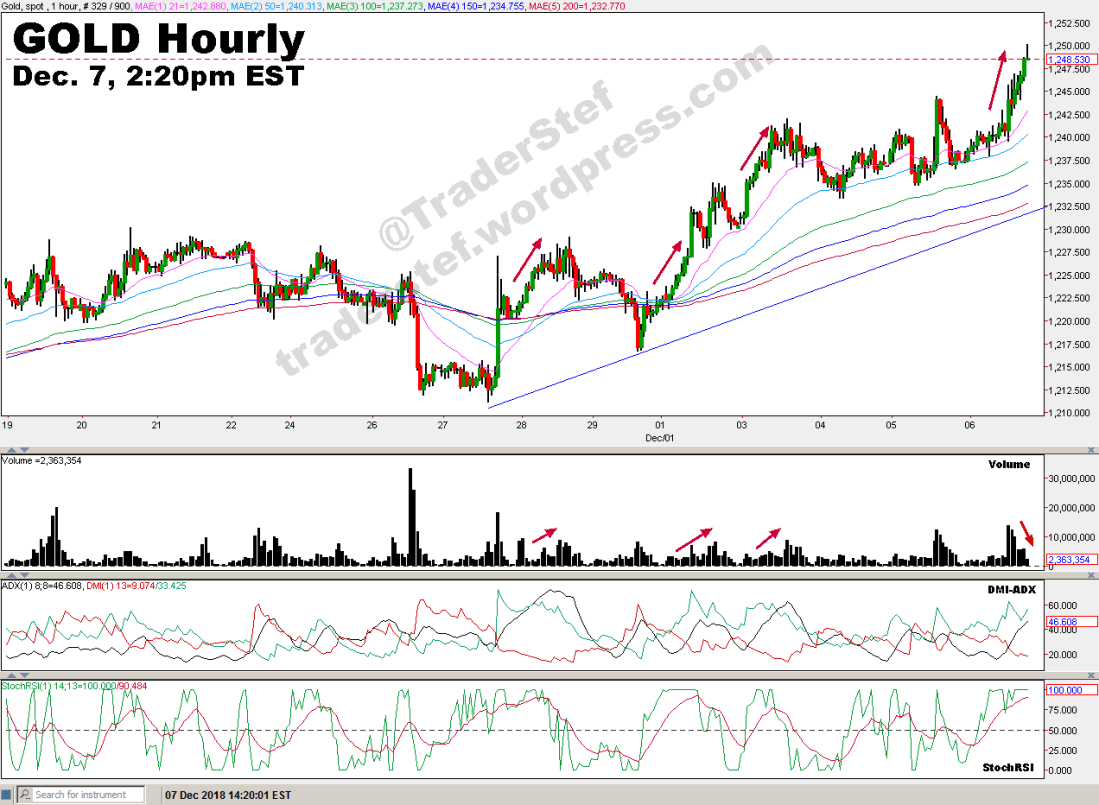
As of 2:20pm EST today (Friday, Dec. 7), price has reached a level of substantial resistance in the low $1,250s. Note the hourly chart below. The StochRSI and DMI-ADX remain bullish but volumes are falling as price is rising today, and that divergence may indicate a correction is near.
If you are in a swing or intraday position, it would be prudent to decide before close of day whether you prefer to hold through the weekend – or take profits and re-enter after the $1,250 level is taken out on strength.
*************************
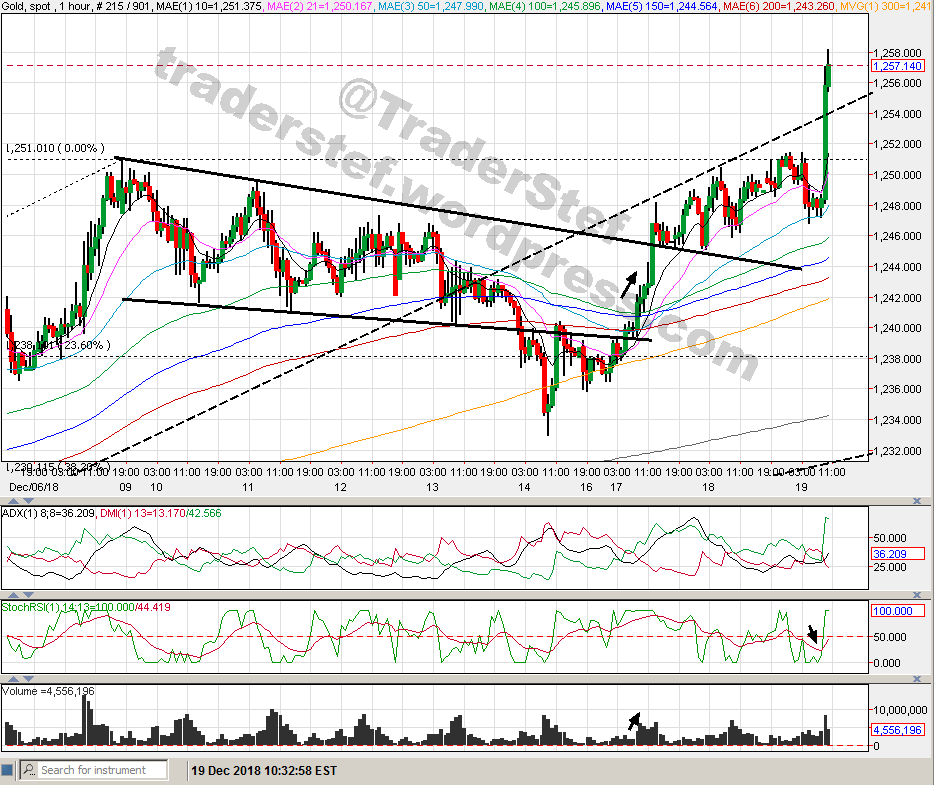
Posted on Twitter– Gold Hourly Chart December 19, 2018 10:30am EST exclusive update for followers….
Plan Your Trade, Trade Your Plan
TraderStef on Twitter
Website: https://traderstef.wordpress.com


3 thoughts on “Gold and Silver Sweetspot Alert – Update”
Comments are closed.