

Originally published on August 21, 2019 by TraderStef at CrushTheStreet.
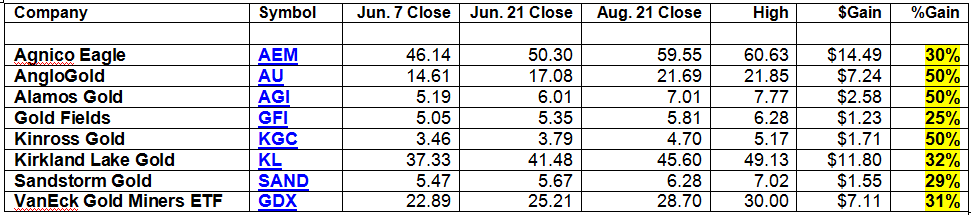
Twelve weeks ago, I published “Minding the Gold Mining Stocks and GDX” and followed that analysis with “Gold Mining Stock Poker and the Gold Bugs Index Breakout” on Jun. 21. A list of mining equities to consider were included, along with the $GDX and $HUI Gold Bugs Index. In case you missed it, my latest technical analysis on gold can be found at “NIRP Supports Gold’s Explosive Rally with Ultra-Bears and Ghosts in the Asylum,” published on Aug. 15. To view a larger version of any chart, right-click on it and choose your “view image” option.
“After scanning all the mining stocks on June 2, my summer intern and I selected a few miners to consider from a technical analysis point of view. Many looked promising due to the rally in gold that began at the end of last week, but few adhered to selection preferences. The primary filter is high volume with a minimum of 1 million shares traded on an intraday basis and no dead minutes to ensure tradable liquidity for scalps or swings, and then chart patterns and studies that indicate the potential for a near-term rise in price. The last issue you want regardless of your investment time horizon is to be sitting on a large block of shares with no liquidity and a bid/ask flow and volume giving you the middle finger when trying to close out positions.”
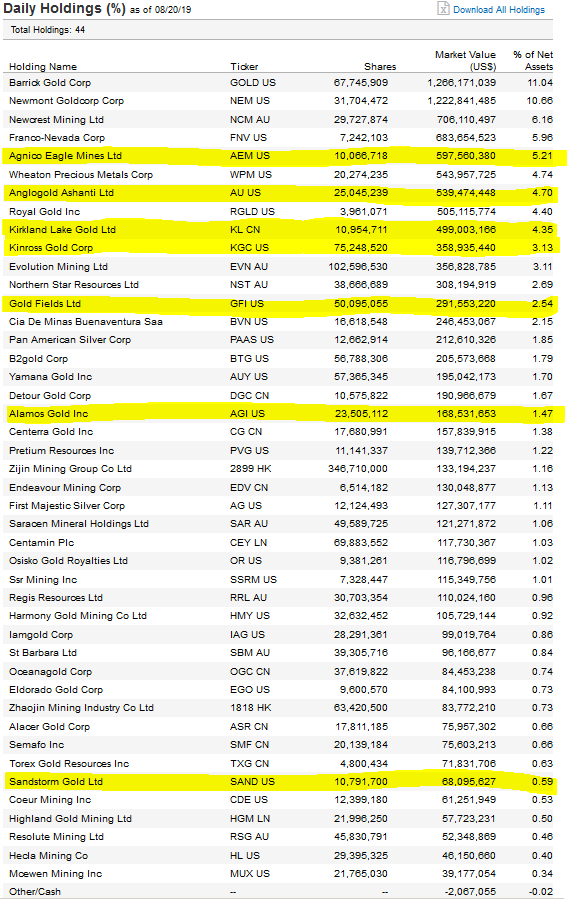
$GDX VanEck Vectors Gold Miners ETF basket as of Aug. 20, 2019. The mining stocks noted above are highlighted:
GDX monthly chart as of Aug. 21, 2019, 4pm EDT close…
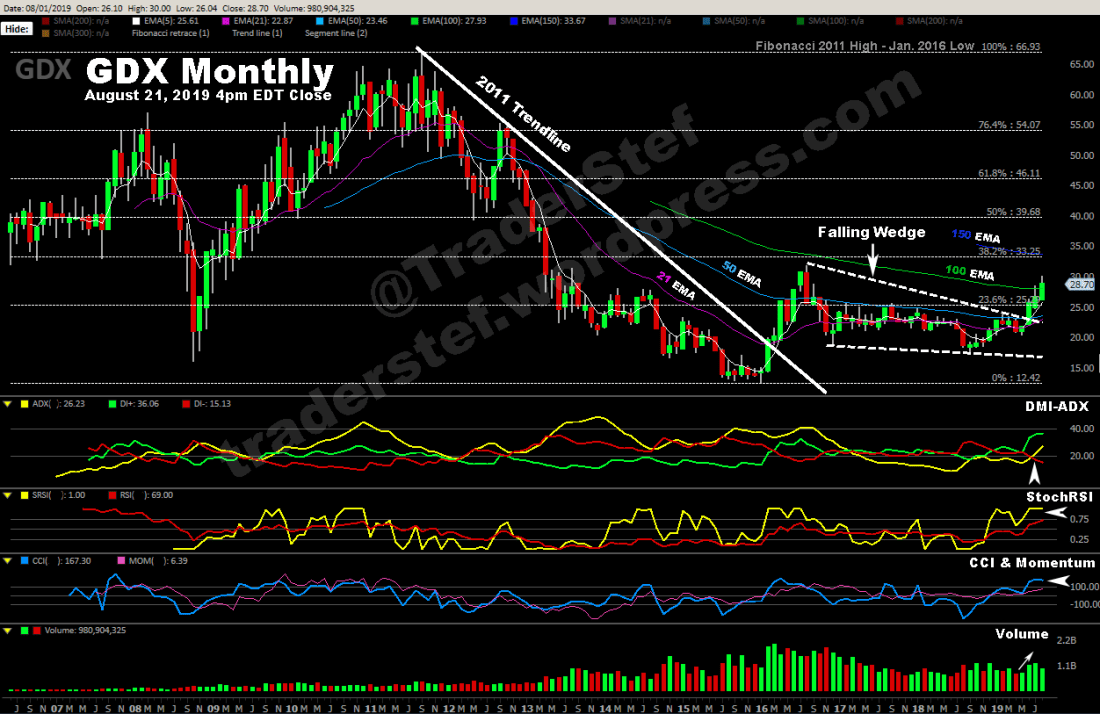
Excerpt from the Feb. 8 monthly analysis:
“After GDX reached a high of $66.98 in Sep. 2011, the price plunged 88%+ over a 4 1/4-year period to end with a $12.40 low in Jan. 2016. The price pivoted to a high of $31.79 by Aug. 2016, then formed a Falling Wedge until its topside trendline was breached in Jan. 2019. The buy volume will need to come back to life for the price to breach the 50 SMA and rally to the 23.6% Fibonacci at $25.30, which is where previous attempts have failed over the last 2 years.”
Excerpt from the Jun. 21 monthly analysis:
“The 50 Simple Moving Average (SMA) and Exponential Moving Average (EMA) have been breached after 5 months of sideways chop and the Falling Wedge is history, but the 100 SMA overhead has not been challenged yet and the rally hesitated at the 23.6% Fibonacci retrace level. The most important indicator on this chart is the DMI-ADX – Alligator Tongue tease, as all the ingredients are present for liftoff if the ADX ventures into the mouth with an upside angle. The StochRSI and Momentum studies continue on an upward trend and the CCI is approaching overbought territory. The chart is bullish overall and the monthly buy volume is on track to best the previous month. The potential exists for a rapid $8 run in the near-term to the 38.2% Fibonacci level.”
The price action on the monthly chart developed as predicted in the previous analyses. The overhead 100 SMA is in the crosshairs this month and the candlestick has enough breadth for the price to close above the 100 SMA. The ADX moved upwards to confirm a bullish Alligator Tongue, the Momentum indicator is rising steadily, the StochRSI and CCI are hovering in overbought territory and may remain there for an extended period, Volume grew over the last three months along with the price, and August is likely to match or exceed July’s Volume print.
GDX weekly and daily chart as of Aug. 21, 2019, 4pm EDT close…
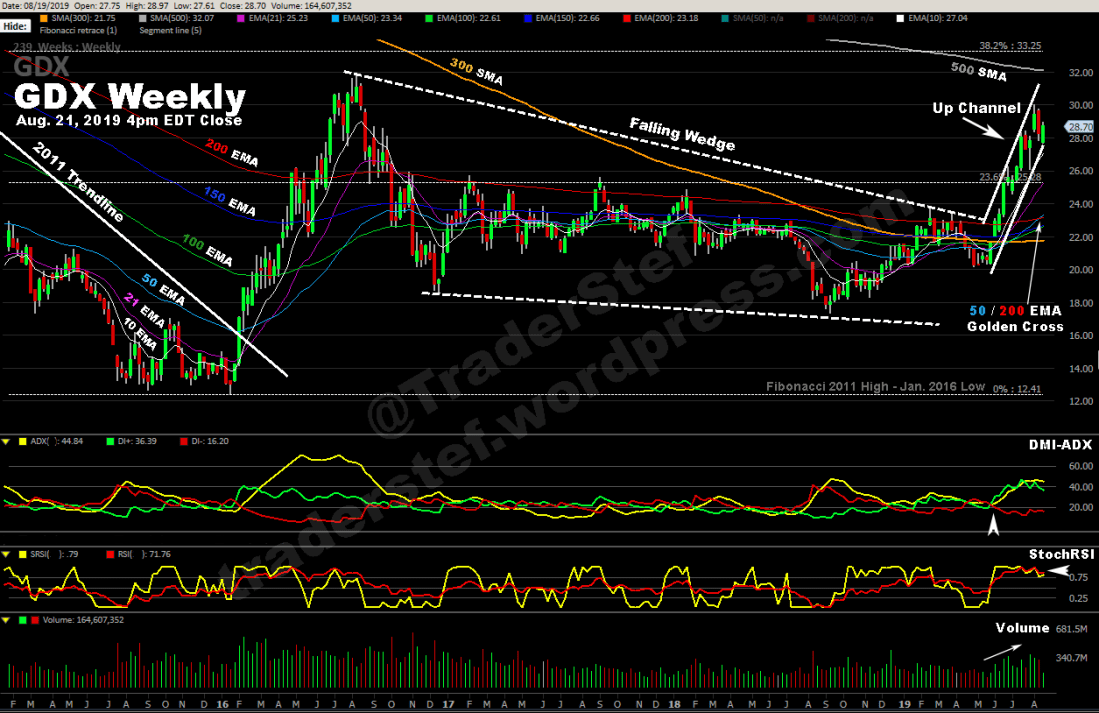
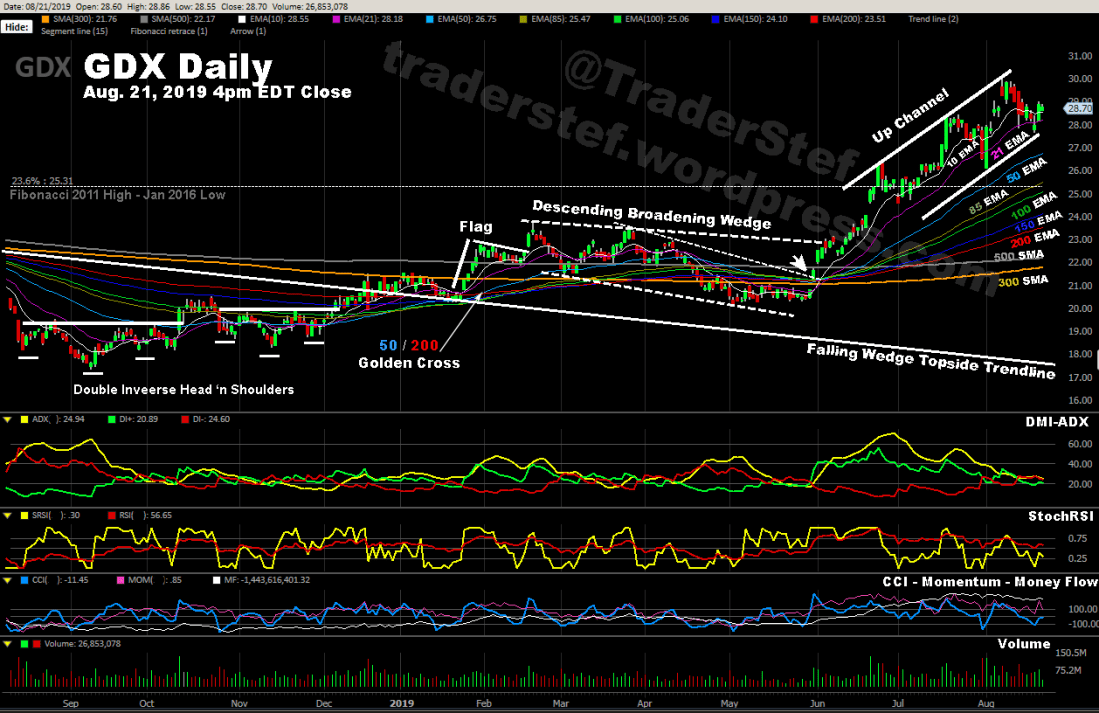
Excerpt from the Feb. 8 daily analysis:
“A 50/200 EMA Golden Cross occurred at the peak of the Flagpole & Flag. The DMI-ADX remains in a positive trend, the StochRSI is hesitating, and as noted on the monthly, the buy volume will need to come back to life for the price to breach the 50 SMA on the monthly and rally to the 23.6% Fibonacci level at $25.30.”
Excerpt from the Jun. 7 daily analysis:
“After mirroring gold’s Falling Wedge price action that began in late Feb. 2019 with GDX’s Descending Broadening Wedge, the price (briefly) fell back below all the moving averages… Over the last three trading sessions, the price has attempted to break free from the topside trendline of the Descending Broadening Wedge… The buy volumes spiked on the initial surge in price but fell off while challenging the topside trendline of the Descending Broadening Wedge. If gold manages to break above its $1,350 resistance with conviction in the near-term, I suspect the miners will follow with gains in price. The next price target and resistance on the GDX would be the overhead Fibonacci level at $25.30, and then the 38.2% Fibonacci at $33.25.”
Excerpt from the Jun. 21 daily analysis:
“The DMI-ADX Alligator Tongue on the daily chart was a picture-perfect setup….. The buy volume spike on Thursday followed Wednesday’s FOMC meeting, which launched the price into a gap-up that tapped the overhead 23.6% Fibonacci level… If the price action takes a breather, it is important that the price not violate the gap to the downside on a large sell volume spike. If gold continues on an upward path without much hesitation in the near-term, the miners will likely follow along for the ride. As I type tonight, the gold price is challenging last week’s high of $1,412 after closing around $1,398 on Friday.”
I will only offer commentary on the daily chart this evening and leave the weekly for all to peruse.
It is important to note that when the price fell below all the moving averages in May, the 50/200 Golden Cross was violated for only a couple of days and reaffirmed at the first gap-up in price (see the fat white arrow on the daily) on May 31. The price action did not violate the subsequent gap-up from Jun. 20, and it took a breather with a sideways chop along the 23.6% Fibonacci level near $25.30. The price held firmly above the 10 and 21 EMA until July 31, where a brief correction and pivot formed the Up Channel pattern that currently dominates the chart.
The GDX has mixed signals on the studies, as gold is deep into another consolidation pattern. The DMI-ADX has settled into a negative pattern, but it’s been indecisive and flat since the July 31 upside pivot. The StochRSI also settled into a negative pattern, but with brief spikes to the upside as the CCI, Momentum, and Money Flow all look to be steadily rolling over. The Volumes are mixed, and today’s print was far below the recent spikes. At the tail end of undecided studies, the price pivoted to the upside again, which confirmed the Up Channel with a second tap on the lower trendline, but the price action appeared weak during the pivot process.
I remain bullish long-term as long as gold runs the show with its bull market, but I must take a neutral stance for now until gold completes its consolidation pattern. If gold breaks down any further or goes decisively below $1,483, the miners will likely follow and the price will break through the lower trendline of the Up Channel.
$HUI Weekly chart of NYSE ARCA GOLD BUGS INDEX and a link to the list of mining stocks in its basket:
“What it is: The Gold BUGS Index (also known as HUI) is one of two major gold indices that dominate the market. BUGS is an acronym for ‘Basket of Unhedged Gold Stocks.’ The index was introduced on March 15, 1996. How it works (Example): The Gold BUGS Index is made up exclusively of mining stocks that do not hedge their gold positions more than a year-and-a-half into the future. The Gold BUGS Index is comprised of 15 of the nation’s largest unhedged gold mining stocks. It is a modified equal-dollar weighted index. As a result, most of the index’s component stocks are equally weighted with the exception of a few of the largest stocks, which are more heavily weighted. Why it Matters: The Gold BUGS Index and the Philadelphia Gold and Silver Index (XAU) are the two most watched gold indices on the market. HUI is more volatile. When gold prices are on the rise, the Gold BUGS Index provides an excellent way for investors to capitalize on that increase. The index has a high correlation to the spot price (current price) of gold. When the price of gold declines, the Gold BUGS Index tends to fall much faster than its hedged cousin, the XAU.”
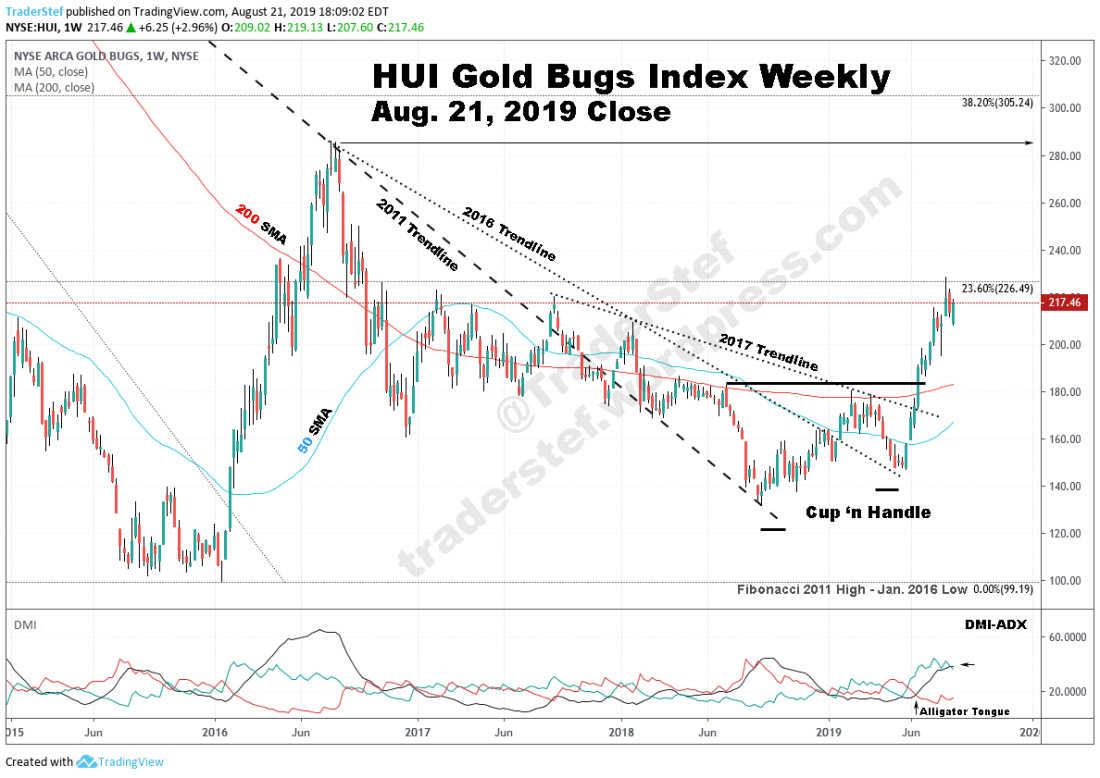
Excerpt from the Jun. 21 weekly analysis:
“Friday’s $10 gap-uplaunched the price out of the Cup ‘n Handle pattern… The 50 EMA is history and the Alligator Tongue is setting up for a bullish run if the ADX (black line, a.k.a. the tongue) spikes to the upside. The HUI appears primed for a $40 run up to the 23.6% Fibonacci level.”
The HUI spiked $40 to the 23.6% Fibonacci without much resistance. There is not much standing between the current price level and the $290 high from Aug. 2016. The 38.2% Fibonacci at $305 is the next target area.
Thursday and Friday will be full of financial headlines, industry pundits, and central bankers talking up a storm about monetary policy during the Jackson Hole 2019 Economic Policy Symposium. Jay Powell is scheduled to give his speech on Friday at 10am EDT. We could be in for some wild swings in the financial markets.
- Global trade war tensions pave the way for currency war: IMF forecast – AhramOnline, Aug. 21
- The Fed Has Few Options, Says Danielle DiMartino Booth – Enterprising Investor, Aug. 20
Angelina Jordan – I Put A Spell On You
Plan Your Trade, Trade Your Plan
TraderStef on Twitter
Website: https://traderstef.wordpress.com
————

NONE of the content produced by TraderStef, staff members, or any services associated with this website should be construed as financial or investment advice. Financial investment is a risky endeavor and may lead to substantial loss. Always perform due diligence before undertaking any financial decision. Not a Financial Advisor.
Copyrighted Material – A “by TraderStef” credit linked back to this website is required when using any quotes, written material, technical analysis charts, or publishing a full version of an article.
————


One thought on “Gold Mining Stock Poker and the Gold Bugs Index Breakout Part 2 – Technical Analysis”
Comments are closed.