

Originally published on Feb. 13, 2022 by TraderStef at CrushTheStreet
Before continuing with today’s analyses, consider reviewing “Are Gold and Silver Ready to Rally in 2022? – Technical Analysis” published on Dec. 25 (Twitter thread). The pandemic threw a wrench into seasonality patterns of all markets and the precious metals were no exception. In my Christmas article I mentioned that gold and silver were entering one of the most favorable periods of the year due to India’s wedding season demand for precious metals. Recent data confirmed that retail buying in India soared to its highest in 8 years. That news was featured on Bloomberg TV at midnight on Jan. 19 and followed by an immediate increase in buy volume on the gold spot chart. The price action was noteworthy and the machines had a field day reading the headlines.

The World Gold Council’s representative in India that appeared on Bloomberg TV was making the rounds on financial media outlets for a few weeks. His most recent interview was on The Money Show in India.
U.S. consumers joined the precious metals party during the 2021 holiday season.
US Jewelry Sales Surge During Holiday Season… Jewelry was one of the most popular purchases during what proved to be a buoyant season for retail demand, according to Mastercard SpendingPulse. Revenue from the category rose 32% year on year for the two months from November 1 to December 24, Mastercard said Sunday. Proceeds for the festive holiday went up 26% from the same period in 2019. ‘Whether consumers were shopping for themselves or for loved ones, the jewelry sector experienced some of the strongest year-on-year and year-on-two-year growth.’” – Diamonds.net, Dec. 27

Goldman Sachs advised their clientele in 4Q21 that the world is entering a new commodity super cycle and is the best place to invest in right now.
In addition to the fundamental case for real assets that include precious metals, rhetoric and the fog of war surrounding Russia vs. Ukraine and NATO made powerful headlines this past week. Whether or not a false flag operation and imminent invasion are reliable intelligence reports, the markets respond to that narrative by selling equities and buying real assets and government bonds. Get up to speed on the Ukraine situation by reading “The Surge of ‘Little Green Men,’ and Metal is Poised to Strike – Part 3” published on Jan. 29, and subsequent posts on its Twitter thread. The fear generated this past week spiked the price of gold and silver followed for the ride.
US expects Russia to invade Ukraine next week… “National Security Adviser Jake Sullivan told Americans still in the Eastern European nation to get out within ‘24 to 48 hours.’ PBS foreign affairs correspondent Nick Schifrin tweeted that US officials believe Putin has communicated an invasion order to the Russian military and that Washington expects a ‘horrific, bloody’ campaign. According to the report, a Russian attack would be preceded by two days of aerial bombardment and electronic warfare, followed by a ground assault with the potential goal of overthrowing the Kiev government led by President Volodymyr Zelensky” – NY Post, Feb. 11
Putin ‘doesn’t give a sh*t about sanctions’ says ambassador… “He bluntly warned that ‘the more the West pushes Russia, the stronger the Russian response will be.’ The Kremlin’s ambassador to Sweden brushed off the threat of sanctions and boasted Russia had become ‘more self-sufficient’ in response to the ultimatums. Tatarintsev told the Aftonbladet newspaper: ‘We are more self-sufficient and have been able to increase our exports. We have no Italian or Swiss cheeses, but we’ve learned to make just as good Russian cheeses using Italian and Swiss recipes.’ He said the punishments have allowed his nation’s economy and agricultural sector to thrive. Meanwhile civilians in Ukraine have been preparing for an invasion by learning to fire weapons.” – The U.S. Sun, Feb. 13
Much more could be said about crisis in the world today and U.S. economic data points, but let’s see what the gold and silver charts are saying. To view a larger version of either chart, right-click on it and choose your “view image” option.
Gold Spot weekly chart as of Feb. 11, 2022 close…

Excerpt from the Nov. 11 weekly gold chart analysis:
“Gold is still not out of the woods despite a price rally through the $1,830 overhead resistance and printing a high of $1,868 on Wednesday… it might look decisive, but did not occur with a coincident spike in buy Volume… odds are higher for a Momo move when large buy Volume accompanies a rising price… The chart is ripe for scalping sweet spots. It is prudent to wait for a decisive break through $1,980 before layering large paper positions.”
Excerpt from the Dec. 23 weekly gold chart analysis:
“I am seeing analysis that’s drawing a Half Staff Flag from the Aug. 2020 high… As noted in my analyses since this past summer, that Flag ended with a breach above its topside trendline and rally to $1,900 in early spring, which failed to manifest a continuation move to the more important $1,980 overhead resistance. The subsequent pullback revisited the $1,670s and printed an Eve & Adam Double Bottom with a large Hammer candlestick in August. The pivot off that Hammer did not take out the substantial resistance at $1,830 until November. Despite the failure of that rally through $1,830, the price action continues its ride above the 100 Exponential Moving Average (EMA)… For a significant rally to manifest in early 2022, it must coincide with an upside reversal in overall Volume and heavy buying. The chart is ripe for scalping sweet spots, but remain cautious and wait for a decisive break through $1,980 before layering large core positions in paper gold.”
Since the Aug. 2021 low of $1,680, gold rallied to $1,877 in November and retreated to $1,752 in mid-December, then surged to a high of $1,865 and closed at $1,858 this past Friday on concerns that Putin gave the go ahead for his military to move into Ukraine in mid-February or March. Gold’s technical indicators and studies are a mixed bag, but signals are leaning more bullish than they were in December.
After the price action printed an Eve & Adam Double Bottom, a Symmetrical Triangle pattern formed that’s coiling with lower highs drawn back to Jun. 2021 and higher lows since August. Last week’s rally through $1,830 lateral resistance to $1,865 breached the Triangle’s topside trendline by a few dollars and closed on the trendline. Friday’s close was just below an $1,875 Fibonacci level, $1,900 lateral resistance, and a Fibonacci confluence that surrounds the 2011 high at $1,920. The lower highs since Aug. 2020 have reinforced topside resistance levels that the price is struggling to work through.
The 10, 21, and 50 EMA remain stuck together with muted upward progress since October, and the price is riding higher above the 100 EMA than it was last fall. The DMI-ADX is still not set up for an Alligator Tongue power trend to the upside, the StochRSI lacks decisive upside momentum, the Money Flow is flat with rising Momentum, and buy Volume is in a rising trend. There have been repeated buy Volume spikes (see my Feb. 2 hourly chart) that followed shallow dips below $1,800 since early January.
Looks Like There’s a Whale Snapping Up Gold Bullion Below $1,800… “Metal went from $150 discount to a $20 premium to fundamentals. Scale of purchases point strongly toward sovereign buyer… Such activity, which shows up neither in ETF holdings nor in futures positioning, would require a substantial buyer, accumulating in size in the London over-the-counter market (aka Gold Spot). Yet vault holdings reported by the London Bullion Market Association, which include both ETF and some central bank-owned metal, show only a fractional increase in the year through December, from 307 million to 309 million troy ounces..” – Bloomberg, Feb. 2
Gold is not out of the woods and the chart is ripe for scalping intraday sweet spots in either direction. It’s prudent to be patient for a decisive break through $1,980 on much larger buy Volume before layering in large paper positions for swing trades.
Silver Spot weekly chart as of Feb. 11, 2022 close…
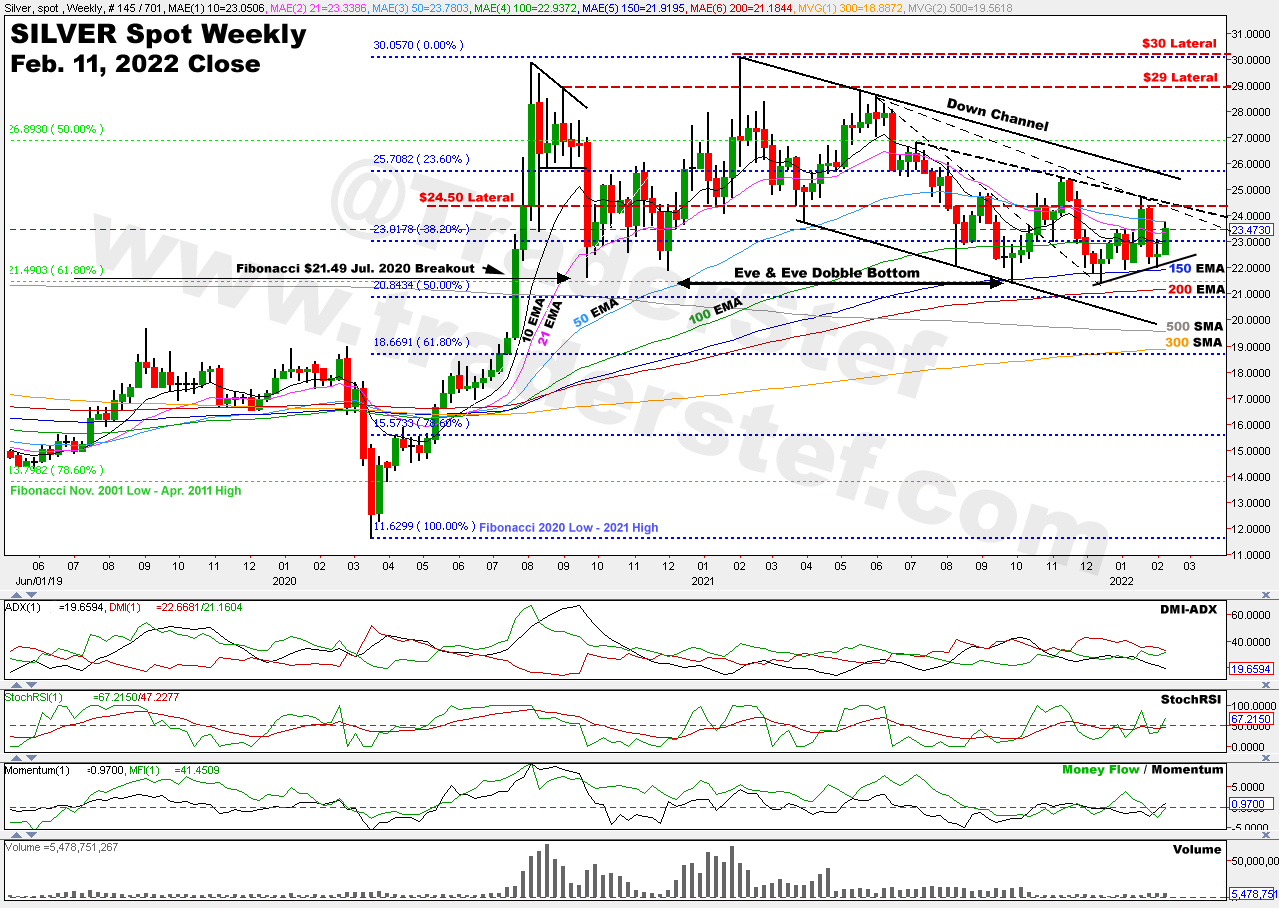
Excerpt from the Nov. 11 weekly silver chart analysis:
“Silver is still not out of the woods either, despite a price rally through the overhead 50 EMA and printing a high of $25.26 today… I cannot stress enough how important it is that a substantial rise in buy Volume take place to sustain the current upside momentum.”
Excerpt from the Dec. 23 weekly silver chart analysis:
“Silver stackers and the silver squeeze crowd are not thrilled about the price action in paper markets, but demand for physical bullion, coins, and the premiums to purchase at retail are as elevated as last year… What has developed is a bullish Eve & Eve Double Bottom… Support at the $21.49 Fibonacci level has a substantial number of long positions beneath it… The price action is currently riding above the 150 EMA with near-term overhead resistance at $23… If $21.49 is breached to the downside on large sell Volume, expect a downward spike that is short-lived. Topside resistance going forward is $23, $25.70, then $29 and $30 for all the marbles.”
The silver price is volatile and choppy since printing a $21.42 low in Sep. 2021 and $21.41 in early December. A high of $24.70 was made in mid-January that was followed by a dip to $22 during the first week of February. Silver rallied alongside gold on concerns over Russia and Ukraine with a high of $23.71 and closed on Friday at $23.47. The bigger picture includes an Eve & Eve Double Bottom and a Down Channel drawn from the 2021 high. The Channel’s topside trendline is currently crossing over the $25.70 Fibonacci resistance level.
Friday’s rally did not challenge the $24.50 lateral resistance because momentum stalled at the overhead 50 EMA, but the price is still riding above the 150 EMA since the Sep. 2021 low. The DMI-ADX, StochRSI, MoneyFlow, and Momentum are all unremarkable. One spark of bullishness is a rising Volume trend over the last three weeks, but remains relatively low compared to the fall of 2020 and winter 2021.
Silver is not out of the woods and the chart is ripe for scalping intraday sweet spots in either direction. Topside resistance remains at $23 until the 50 EMA is left in the dust, then $25.70, $29, and $30 for all the marbles to layer in large paper positions for a swing trade.
300 – Hot Gates Battle (2006)
Plan Your Trade, Trade Your Plan
TraderStef on Twitter, Gettr, Gab / Website: TraderStef.com
Headline Collage Art by TraderStef

NONE of the content produced by TraderStef, staff members, or any services associated with this website should be construed as financial or investment advice. Financial investment is a risky endeavor and may lead to substantial loss. Always perform due diligence before undertaking any financial decision. Not a Financial Advisor. Copyrighted Material – A “by TraderStef” credit linked back to this website is required when using any quotes, written material, technical analysis charts, or publishing a full version of an article.


4 thoughts on “Gold and Silver Rise in the Fog of War – Technical Analysis”
Comments are closed.