

The last topic I want to discuss tonight is the COVID-19 pandemic, as there is enough coverage on a daily basis no matter where you turn. Regarding supply chain issues that plague the gold and silver industry and an extreme contango condition in the futures vs. spot market pricing, there is a link-garden filled with information to peruse and a great interview at the end of this post. Let’s dive right into the technical analysis on gold.
“The seasonality pattern for gold to rise has coincided with numerous geopolitical events and the coronavirus outbreak. Gold is currently in a spot where it typically makes a run before early spring doldrums take hold. The window of opportunity remains open as gold is approaching an important resistance level just shy of its January $1,611 high.” – TraderStef, Feb. 16
The gold price remains in-line with its seasonality pattern despite a wicked bout of volatility in March.

To view a larger version of the following charts, right-click on it and choose your “view image” option.
Excerpt from the Jan. 27 weekly chart analysis:
“It would not take much for the price action to revisit the $1,611 high and enter the gap between $1,620 and $1,697, where not much resistance exists until the $1,733 Fibonacci. The $1,620 and $1,697 laterals originate from the choppy price action between the $1,920 high in 2011 and downside breach of $1,522 in 2013, and $1,733 is where the Up Channel’s topside trendline will intersect.”
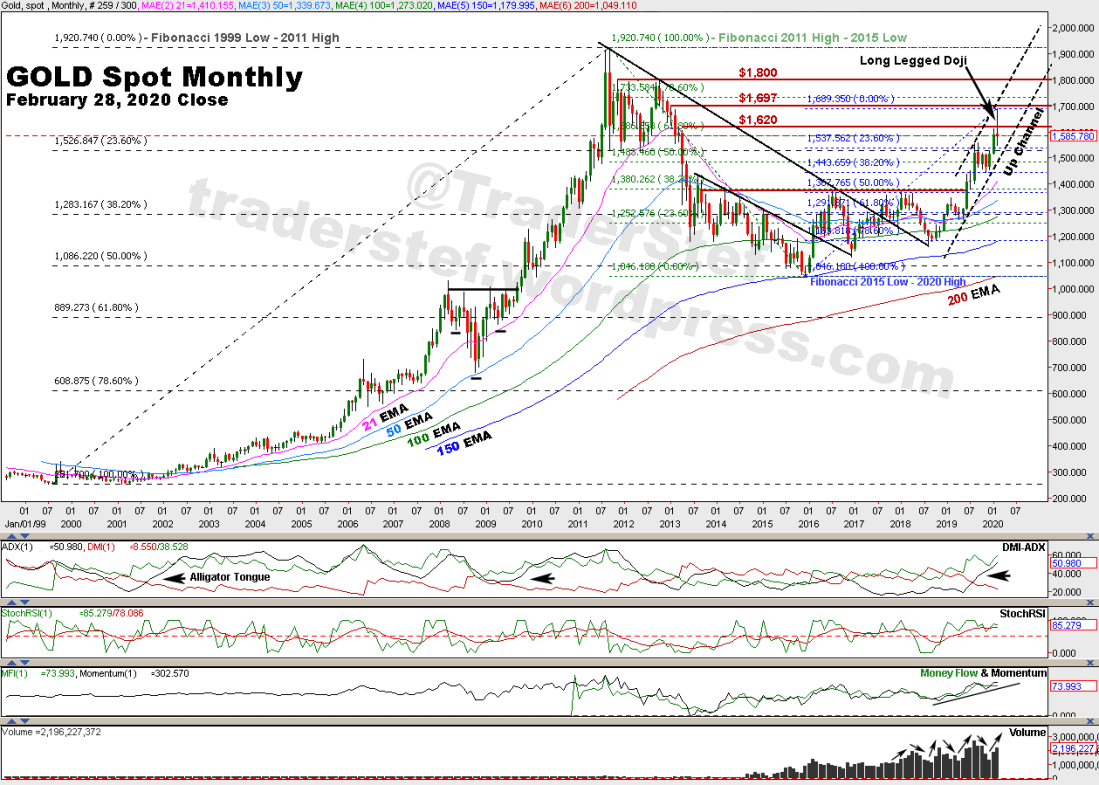
Excerpt from the Feb. 28 monthly chart analysis:
“Gold’s Primary Bull (accumulation phase vs. secular bull) liftoff in 2016 remains intact and is having healthy bouts of consolidation and bullish chart patterns along the way… When considering the daily and weekly chart closes, the most likely scenario will be a period of chop and consolidation because gold is fast approaching the doldrums of early spring due to seasonality patterns. All of those variables could be instantly whacked into submission if the Fed suddenly announces additional accommodative monetary policy measures in response to the COVID-19 pandemic.”
-
Fed cuts interest rates by 1/2 point in rare inter-meeting move – MarketWatch, Mar. 3
-
World Health Organization Declares COVID-19 a ‘Pandemic.’ – Time, Mar. 11
Gold weekly chart as of Mar. 13, 2020 close…
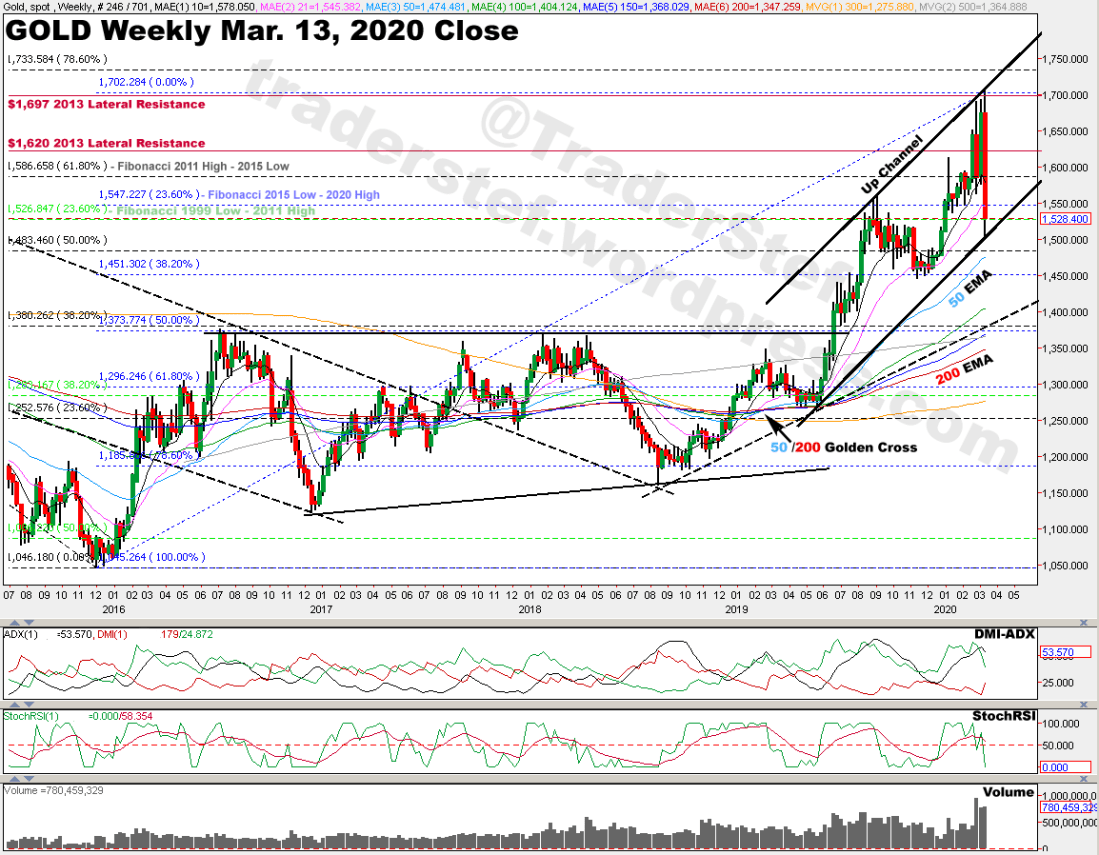
Excerpt from the Mar. 13 weekly chart analysis:
“Despite the pullback in price, gold remains in an uptrend and its primary bull is intact. I still expect several episodes of chop and consolidation before the 2011 all-time high is successfully challenged. Last week, the gold price opened at $1,673.89, printed a high of $1,703.20, put in a low of $1,504.30, and closed at $1,528.40.”
In case you missed it, gold futures and the spot price had a RYPO move (i.e. the Coppertone Girl) on Mar. 23, 2020 (link to “London is buying” Twitter heads-up), and the futures tacked on an additional $100 while trading into the London market after the following 10pm screenshot:

Gold Spot daily chart as of Mar. 25, 2020 11am EST…

Excerpt from the Mar. 25 daily chart analysis:
“As noted throughout my analyses since 2016 and despite recent volatility, gold remains in a primary bull uptrend. It appears that a Bear Trap printed last week just below an Up Channel that took root in Jun. 2019.”
The following screenshot includes a gold futures bar chart from James Turk that highlights a potential Inverse Head ‘n Shoulders Continuation pattern. Gold Spot does not due to the right shoulder printing too low, but does print a solid Cup ‘n Handle. Which one is right in a broken paper market? Both, but spot includes a diverse compilation of contracts from multiple futures and cash markets, which adds more weight to its accuracy.

Gold Spot daily chart as of Apr. 8, 2020 5pm EST…
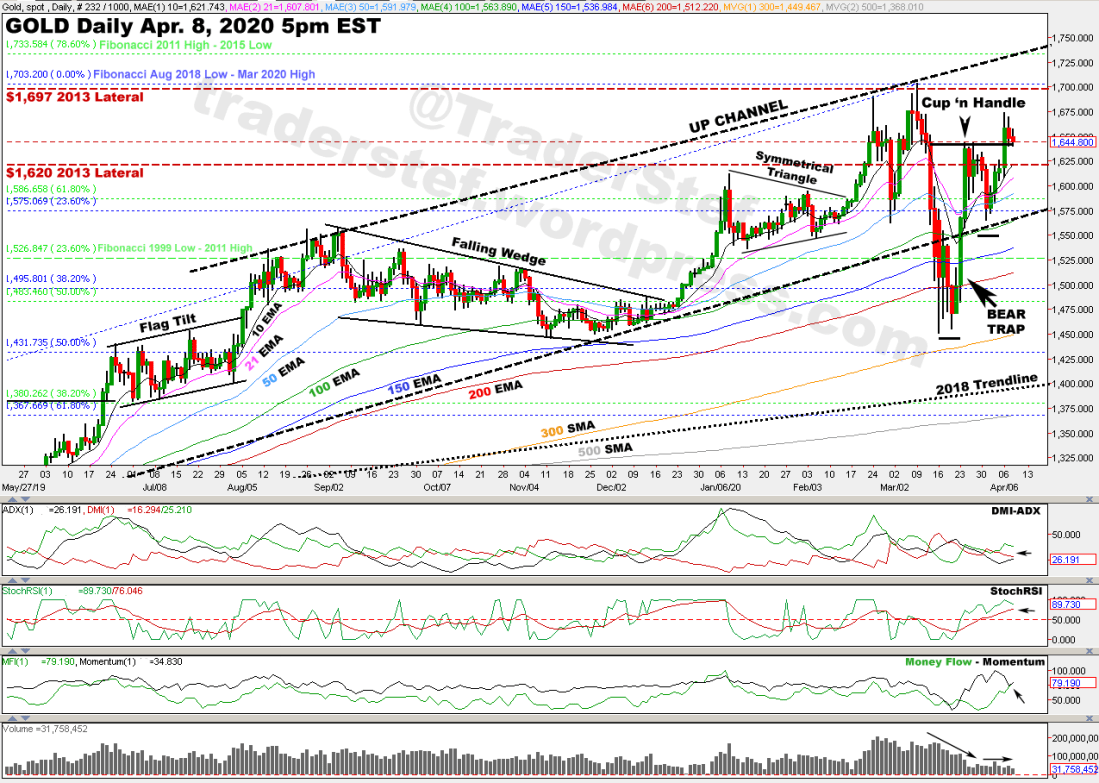
As I type this analysis, gold spot is trading at $1,648 per ounce and futures at $1,682. In the meantime, the one-ounce gold 2020 American Eagle uncirculated coin will set you back a cool $1,900, and $2,275 for a proof coin at the U.S. Mint while supplies last. Premiums for gold and silver are through the roof and inventory is hard to locate at retail dealers.

The Bear Trap noted on Mar. 25 confirmed after the price pivoted violently upwards and back into the Up Channel, then successfully retested support inside the lower trendline on Apr. 1 . That price action formed a Cup ‘n Handle with a price break above its rim-line on Apr. 6, and the rim-line is being tested as support this evening.
Despite extreme volatility, the price action is closing back above all Exponential (EMA) and Simple Moving Averages (SMA), the DMI-ADX is set up for a bullish Alligator Tongue, the StochRSI has reached an overbought level but can levitate for a while, and the Momentum and Money Flow are trending upwards. Volume is steady, but flat due to the over-extended Contango condition in the market. The issue has not yet normalized since the dislocation between the futures market and spot price occurred on Mar. 24 in London (see hourly chart noted above). There will be additional chop and consolidation before $1,700 is left in the dust.
Here are a few articles and interviews to peruse since my last gold analyses before closing up shop tonight:
-
Coronavirus Fallout Reaches Some of the World’s Remotest Mines – WSJ, Mar. 17
-
The Gold Market Is Being Tested Like Never Before – Bloomberg, Mar. 26
-
South Africa gold shipments to London were disrupted – MoneyWeb, Mar. 27
-
World Problems: Current State of Gold Market In Plain Language – VOIMA, Mar. 27
-
The Wild Hunt for 100-Ounce Gold Bars – Bloomberg, Mar. 27
-
‘There is no gold.’ Bullion dealers sell out in panic buying – MarketWatch, Mar. 28
-
Physical Demand Wreaks Havoc on Futures Exchanges – Money Metals, Mar. 30
-
VIDEO: Michael Pento – This is a Global Depression – USAWatchdog, Mar. 31
-
Gold Dealers Report Big Shortages of Small Bars and Coins – Bloomberg, Apr. 2
-
Mexico mining halt to hit silver supply – Mining.com, Apr. 2
-
Gold Bugs Finally See Their Predictions of Doom Coming True – Bloomberg, Apr. 3
-
Gold Squeeze Had Traders Looking for Bars as Far Away as Sydney – Bloomberg, Apr. 3
-
Swiss gold refiners to resume work, easing supply constraints – Reuters, Apr. 5
-
Yellen says 2Q20 GDP decline 30%, unemployment already 12%-13% – CNBC, Apr. 6
-
303 mines globally temporarily shut down due to the virus – Martin Katusa, Apr. 9
-
Apr. 9 UPDATE: Gold Shows Few Signs of Return to Normal – Bloomberg

-
UPDATE 2: Fed Seizes Control of the Entire U.S. Bond Market – MarketWatch
-
UPDATE 3: Unemployment Claims data via Calculated Risk…

The Gold Chronicles – Alex Stanczyk interview w/Jim Rickards – Next Great Depression – Physical Gold Fund, Mar. 27
Plan Your Trade, Trade Your Plan
TraderStef on Twitter
Website: https://traderstef.com

NONE of the content produced by TraderStef, staff members, or any services associated with this website should be construed as financial or investment advice. Financial investment is a risky endeavor and may lead to substantial loss. Always perform due diligence before undertaking any financial decision. Not a Financial Advisor.
Copyrighted Material – A “by TraderStef” credit linked back to this website is required when using any quotes, technical analysis charts, or publishing a partial version of an article.


One thought on “Gold a Safe Haven as a Pandemic Locks Down the World – Technical Analysis”
Comments are closed.