

A quick peek at the gold spot chart this morning for my website followers. In order to put this snapshot into perspective, revisit the charts from my Apr. 8 analyses and note the Apr. 14 Tweet copied below. To view a larger version of the following chart, right-click on it and choose your “view image” option.
Gold 4-hour chart as of Apr. 22, 2020 at 7:35am EST…

The price action is positive at $1,700 but not quite out of the woods. A double top (Mar. 14-15: $1,747 & $1,739 high) Big-M pattern set the stage for a needed breather and consolidation after a spectacular recovery out of the Bear Trap. Price is making progress this morning with a peek out of the Half Staff Flag‘s topside trendline and remains above the 50 Exponential Moving Average (EMA). There is a confluence of lateral resistance that must be dealt with around the $1,700 area before moving onward. The gold chart remains bullish so stay on your toes.
- UPDATE Apr. 23-24… Gold spot printed a $1,739 high, closed at $1,727 for the week.
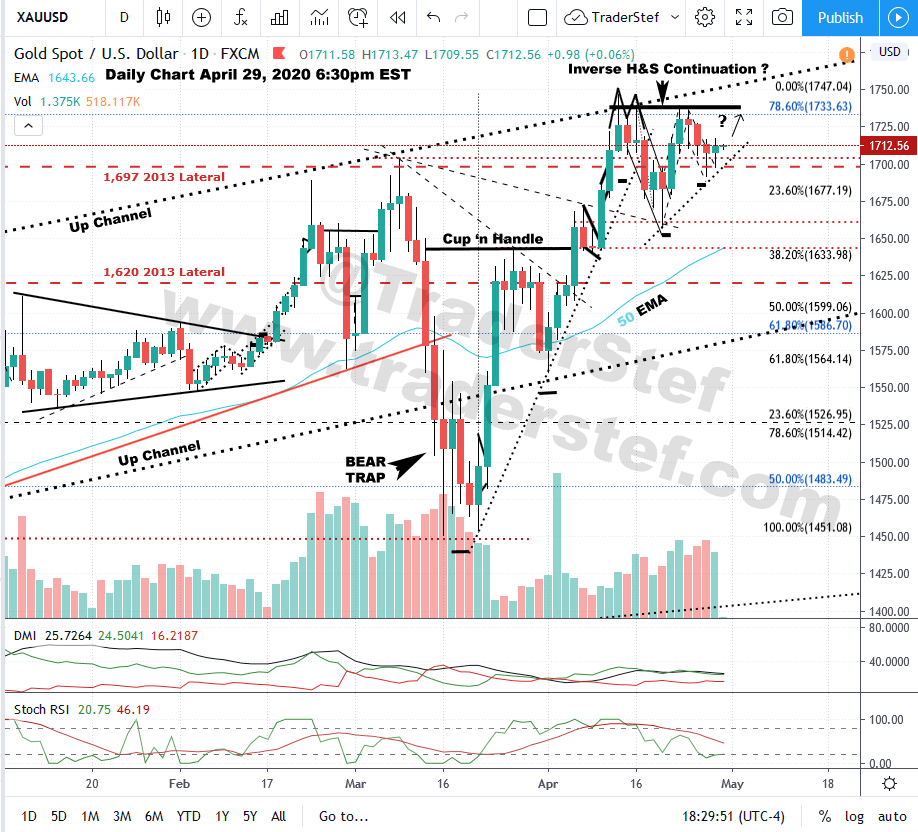
- UPDATE Apr. 29, 6:30pm EST…

- UPDATE May 1, 7:30am EST… near-term potential for the Inverse H&S continuation pattern on the gold spot charted on Apr. 29, cancelled itself out over night, but could be morphing into a Big-W. Stay tuned as gold is bullish.
We are approaching the end of spring seasonality.
RIP Prince (April 21, 2016) – Sometimes It Snows in April
Plan Your Trade, Trade Your Plan
TraderStef on Twitter
Website: https://traderstef.com


One thought on “Gold Chart Exclusive for Precious Hour Subscribers”
Comments are closed.