

I published an analysis of several mining stocks to consider in June 2019 with subsequent updates, and the most recent “Gold & Silver Mining Stocks for Late Winter 2020” was published on Feb. 23. Here is an update on those miners’ with no changes at this time, but do add $KGC to your watchlist. A technical analysis on gold is found below.
“After scanning all the mining stocks… I selected a few miners to consider from a technical analysis point of view. Many look promising due to the rally in gold… but few adhere to my selection preferences. The primary filter is high volume with a minimum of 1 million shares traded on an intraday basis and no dead minutes to ensure tradable liquidity for scalps or swings, and then chart patterns and studies that indicate the potential for a near-term rise in price. The last issue you want regardless of your investment time horizon is to be sitting on a large block of shares with no liquidity and a bid/ask flow and volume giving you the middle finger when trying to close out (or add) positions.” – Jun. 7, 2019
“The performance of the following miners is based on the first “close” date a price populates in a column vs. the most recent high. Carryovers are retained due to their near-term positive technicals. A few overboughts or underperformers were benched at some point during 1Q20. Here are links to the $GDX VanEck Vectors Gold Miners ETF and $GDXJ Junior Miners prospectus if you want to investigate the weighting of their baskets.” – Feb. 23, 2020

We are approaching the end of gold’s spring seasonality pattern.

To view a larger version of the following charts, right-click on it and choose your “view image” option.
Excerpt from my Apr. 22, 4-hour chart analysis:

“In order to put this snapshot into perspective, revisit the charts from my Apr. 8 analyses. The price action is positive but not quite out of the woods. A double top Big-M pattern set the stage for a needed breather and consolidation after a spectacular recovery out of the Bear Trap. Price is making some progress this morning with a peek out of the Half Staff Flag‘s topside trendline and remains above the 50 Exponential Moving Average (EMA). There is a confluence of lateral resistance that must be dealt with at $1,700 before moving onward. The gold chart remains bullish and stay on your toes.”
Gold Spot daily chart as of May 7, 2020 at 7:30pm EST…

The catalyst for today’s $40 price surge to $1,722 began with news on the “Futures Market Seeing Negative U.S. Policy Rate by Early 2021,” and a report on the “U.S. to Remove Patriot Missiles and Troops from Saudi Arabia.” The implied Federal Funds rate for Jan. 2021 is negative (NIRP) for the first time ever.
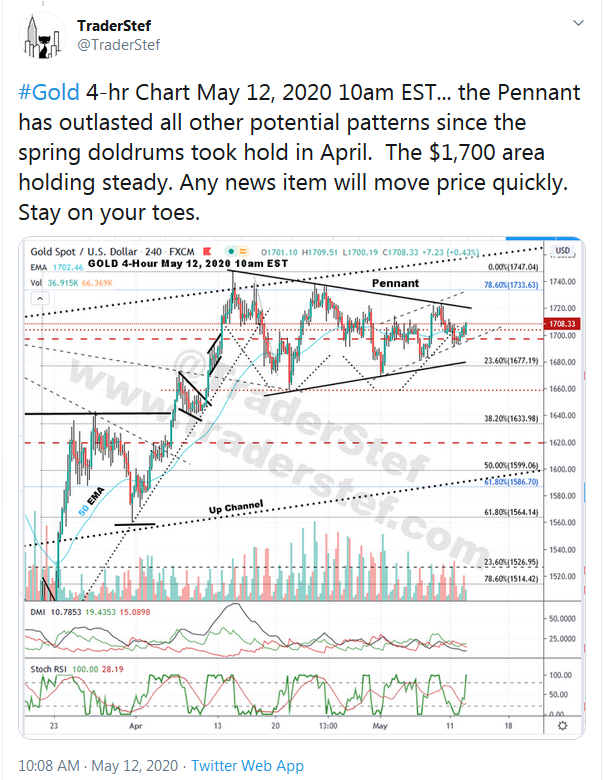
As I publish this analysis, the gold price is $1,720 at 9:30pm and threatening a breakout from the Pennant pattern (completing a Big-W if it reaches the Apr. 14 high of $1,747 in the near-term). Leaving the $1,733 Fibonacci level in the dust is key for the current upward thrust to have any legs. The candlesticks are riding above the 21 EMA and have not broken down to the 50 EMA since the wicked Bear Trap and Cup ‘n Handle in March during the New York vs. London Gold Shortage/Extreme Contango Price Spread. The DMI-ADX is not yet exhibiting an Alligator Tongue power trend to the upside, the StochRSI has just begun to reassert an uptrend, the Money Flow has based out in oversold territory, and the Volume has flat-lined this week. A breakout from the typical spring seasonal pattern does not occur until late May or June, therefore caution is warranted until $1,733 is taken out with conviction and the above-mentioned studies display definitive trends to the upside. Overall, the chart appears to be on the heels of a bullish move towards $1,800.
UPDATE: Gold Spot 4-hour chart May 12…
“There were two gold bull markets; 1971-1980 & 1999-2011. The first produced 2,200% gains and the second produced 635% gains. A simple average is a 1,400% gain. Applied to the $1,050 per ounce bottom (Dec 16, 2015) yields $14,700 per ounce. It is not rocket science. It is history.” – Jim Rickards, May 6
Here are a few articles, charts, and an interview to peruse since my last gold analyses before closing up shop tonight:
1927-1933 greatest period of deflation in U.S., Gold up 75%. Case closed – Jim Rickards
The United States Desperately Needs Inflation And You Need Gold – Fortune, Apr. 7
Gold at highest since Oct. 2012 on back of Fed’s new lending plans – MarketWatch, Apr. 9
It’s not guaranteed every one of the mines will come back online – Katusa Research, Apr. 9

India to issue sovereign gold bonds with interest rate of 2.5% – Reuters, Apr. 13
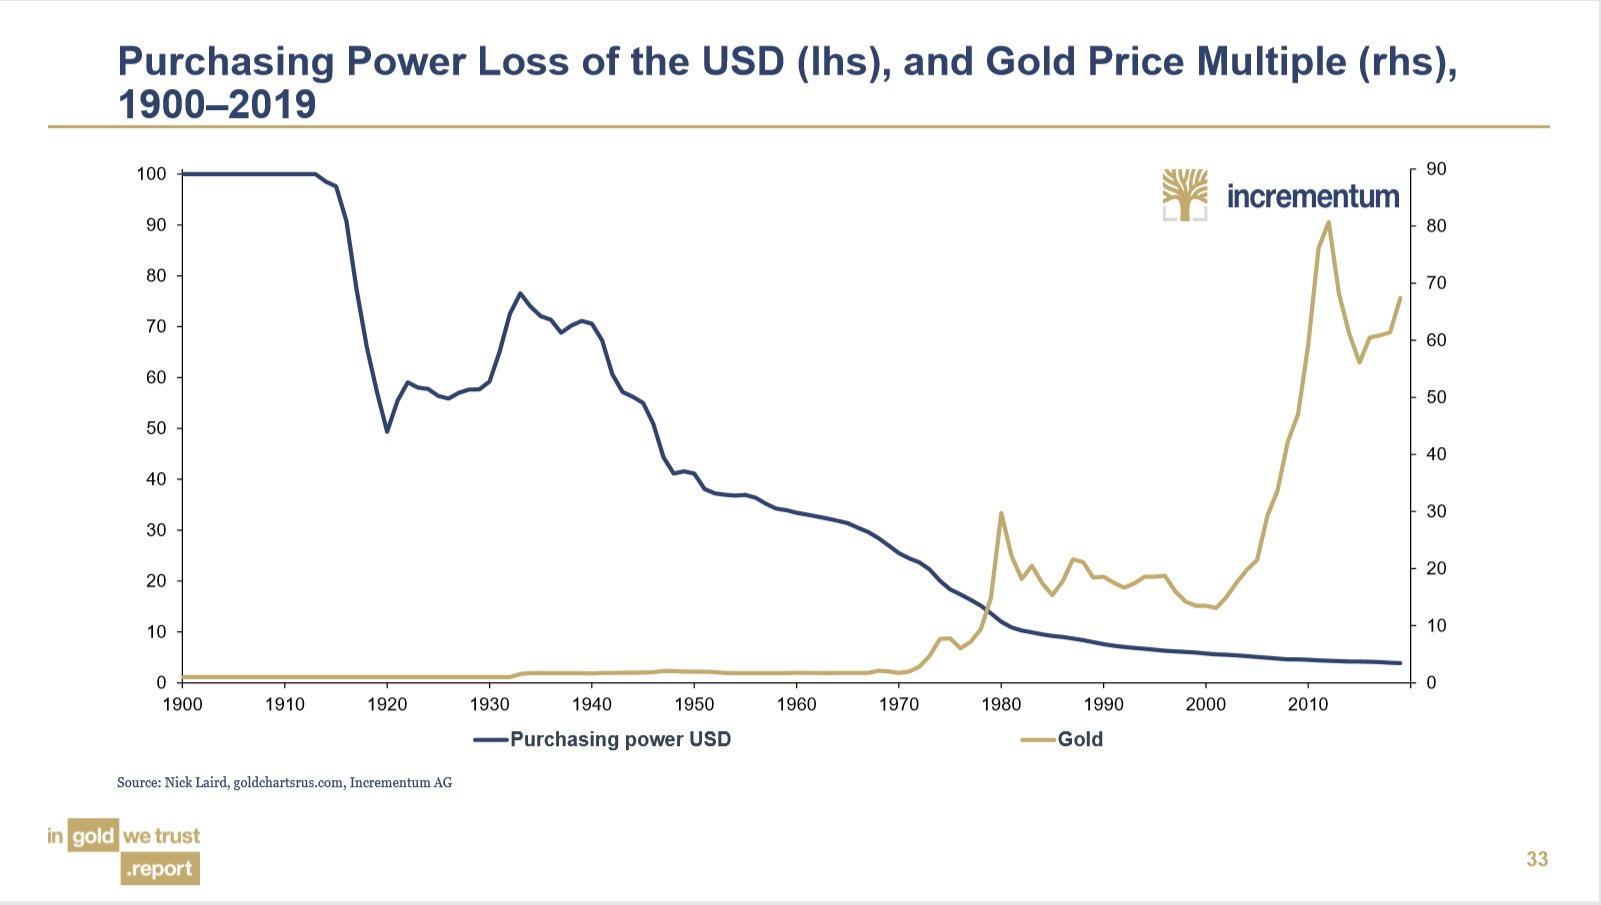
Purchasing Power Loss of USD vs. Gold 1900-2019 – Incrementum In Gold We Trust 2020
IMF Sees Great Lockdown Recession as Worst Since Depression – Bloomberg, Apr. 14
U.S. Mint Plant Halts Gold Coin Output Just as Demand Is Surging – Bloomberg, Apr. 15
Bank of America Says Gold to $3,000, Fed Can’t Print Gold – Bloomberg, Apr. 21
Swiss Gold Exports to U.S. Jump to 8-Year High on Pandemic – Bloomberg, Apr. 21
Gold’s rally deserves Canadian investors’ attention, CIBC says – BNN, Apr. 23
Gold Bars Flying 11,000 Miles to NY to Ease Supply Squeeze – Bloomberg, Apr. 24
Papua New Guinea snatches Barrick Gold’s Porgera mine – Mining.com, Apr. 24
Gold Buyers Are Forking Over Lofty Premiums for U.S. Coins – Bloomberg, Apr. 27
Exclusive: Scotiabank to close its metals business – sources – Reuters, Apr. 28
Silver miners hit hardest by lockdowns — report – Mining.com, Aprl 28
World’s Deepest Gold Mines on a ‘Cliff’ as Virus Cuts Output – Bloomberg, Apr. 29
What Caused NY vs. London Gold Shortage/Price Spread – Jan Nieuwenhuijs, Apr. 30
Gold Demand Up in 1Q20 as Supply Plunges – Peter Schiff, Apr. 30
Covid-19 disrupts $6.9 billion of global mining output – Mining.com, Apr. 30
Gold Demand Trends Q1 2020 – World Gold Council, Apr. 30
Gold Bars Fight Covid Kits for Space on the Plane – Bloomberg, May 3
Gold has ‘growing potential’ to break $1,800 an ounce, says UBS – CNBC, May 4
HSBC Reveals Was Caught Out as Lockdowns Snarled Gold Market – Bloomberg, May 6
Australia trade surplus surges to record on gold rush – Reuters, May 6
Breaking – New normal will demand gold-standard portfolio – UK Reuters, May 6
U.S. FED TOTAL BALANCE SHEET RISES TO $6.77 TRILLION – FED DATA

Lacy Hunt begins a timestamp 19:48 – The Road Through Deflation Toward Eventual Hyperinflation – MacroVoices, Apr. 30
Plan Your Trade, Trade Your Plan
TraderStef on Twitter
Website: https://traderstef.com


2 thoughts on “Mining Stocks Poker Update and Gold Chart Technical Analysis”
Comments are closed.