

There is a confluence of events taking place around the world, including but not limited to the SARSCoV2 pandemic that is devastating the global economy and supply chains, riots and terrorism across the U.S., a global currency reset on the horizon, and China flexing its military muscle with a potential threat to our allies and national security.
U.S. SEC OF STATE POMPEO: THE CHINESE COMMUNIST PARTY’S MILITARY ADVANCES ARE REAL. OUR DEPT OF DEFENSE IS DOING EVERYTHING IT CAN TO MAKE SURE IT UNDERSTANDS THIS THREAT. PRESIDENT TRUMP WILL ALWAYS KEEP US IN A POSITION WHERE WE CAN PROTECT THE AMERICAN PEOPLE – May 31, 2020
A quote of the month that is reminiscent of Ben Bernanke on 60 Minutes in 2009:
PELLEY: Fair to say you simply flooded the system with money?
POWELL: Yes. We did. That’s another way to think about it. We did.
PELLEY: Where does it come from? Do you just print it?
POWELL: We print it digitally – CBS 60 Minutes, May 18, 2020
Here is a brief end-of-month gold chart analysis and a link garden of relevant events and charts. If you are behind the curve or a new subscriber, revisit my analyses published on May 7. To view a larger version of a chart, right-click on it and choose your “view image” option.
We are approaching the end of the typical spring seasonality pattern for gold.

Excerpt from the May 7 gold spot daily chart analysis:
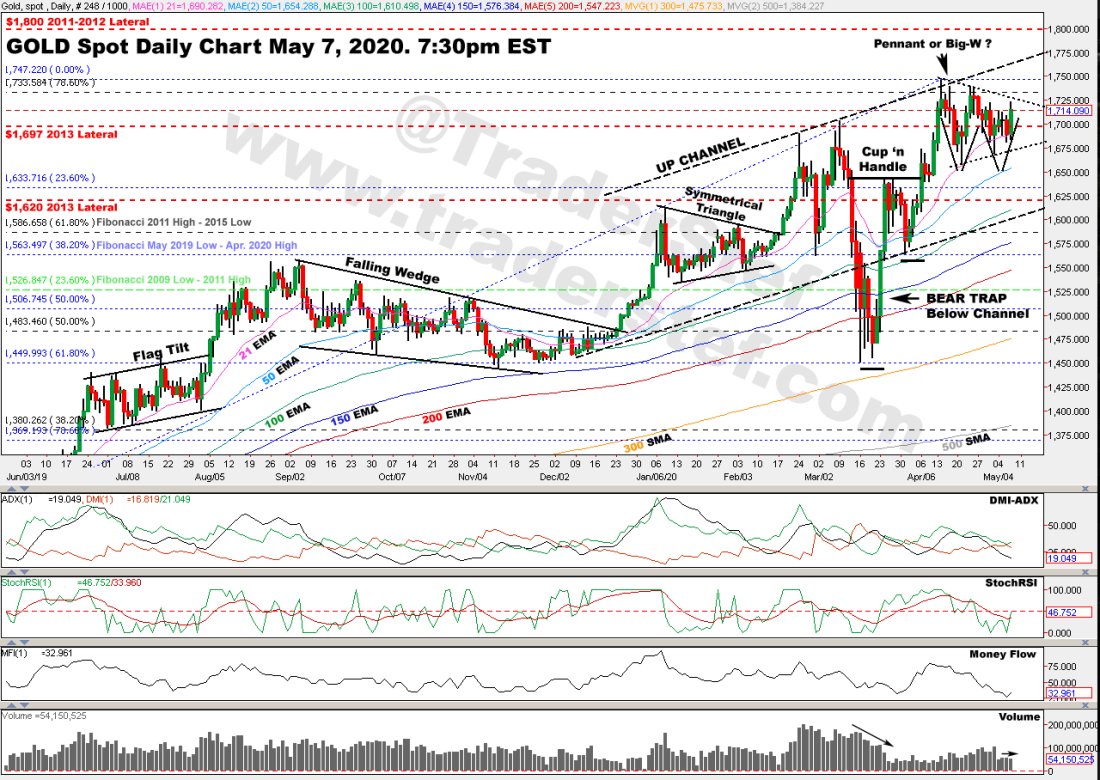
As I publish this analysis, the gold price is $1,720 at 9:30pm and threatening a breakout from the Pennant pattern… Leaving the $1,733 Fibonacci level in the dust is key for the current upward thrust to have any legs. The candlesticks are riding above the 21 EMA and have not broken down to the 50 EMA since the wicked Bear Trap and Cup ‘n Handle in March during the New York vs. London Gold Shortage/Extreme Contango Price Spread. The DMI-ADX is not yet exhibiting an Alligator Tongue power trend to the upside, the StochRSI has just begun to reassert an uptrend, the Money Flow has based out in oversold territory, and the Volume has flat-lined this week. A breakout from the typical spring seasonal pattern does not occur until late May or June, therefore caution is warranted until $1,733 is taken out with conviction and the above-mentioned studies display definitive trends to the upside. Overall, the chart appears to be on the heels of a bullish move towards $1,800.
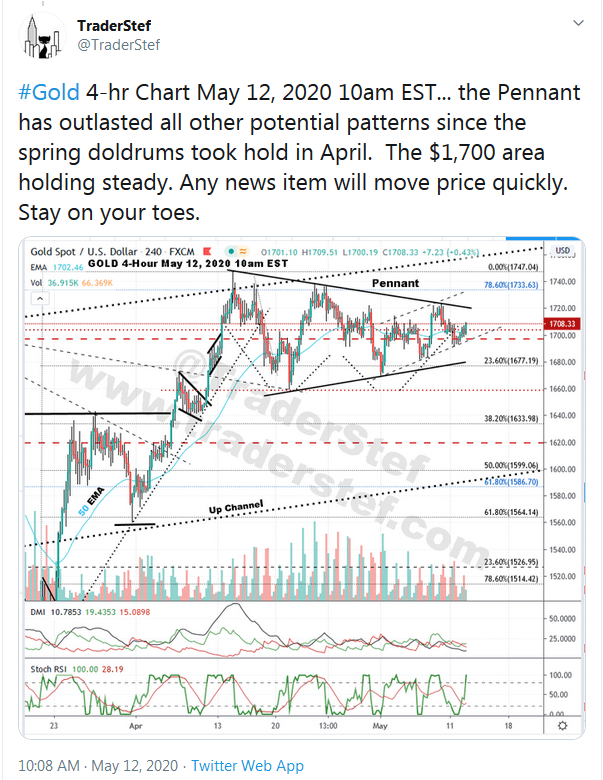
Gold Spot 4-hour chart May 12 update on Twitter:
Gold Spot daily chart as of May 29, 2020 close…
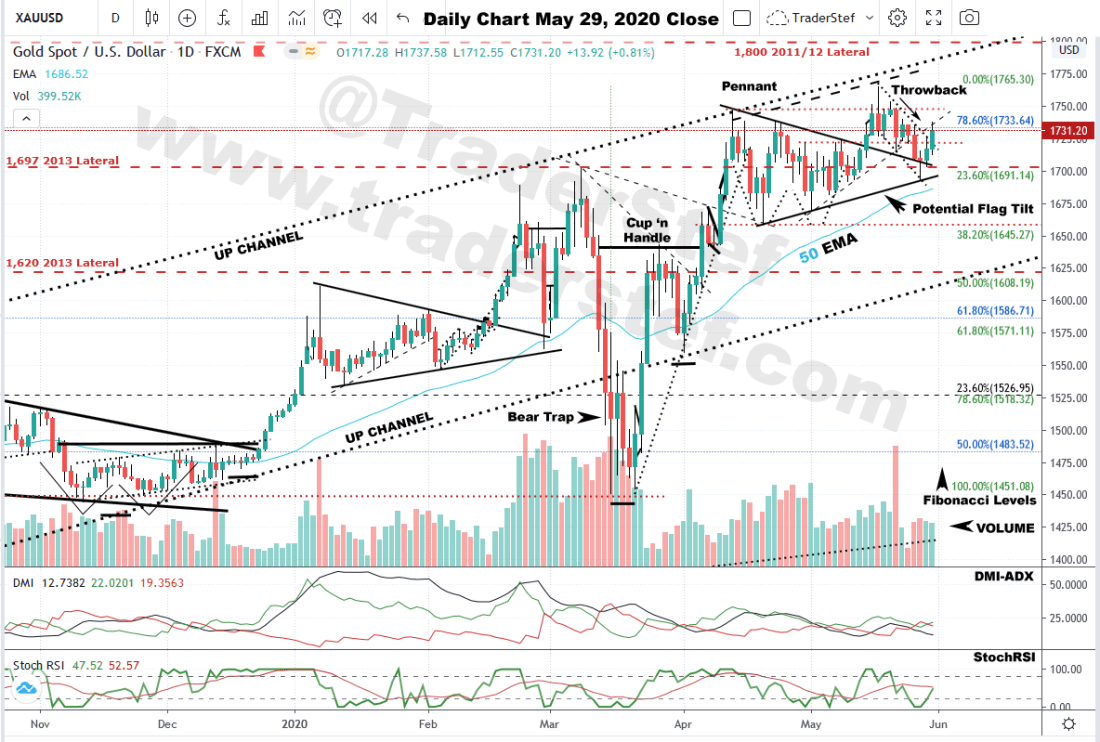
A heads-up was given when the Pennant pattern was breached to the upside on May 14 with a Throwback in the cards to test support at the Pennant.

The price action exhibited a large price Backwardation spread on the morning of May 27, when support at the Pennant was tested and subsequently closed above the Throwbacks’s topside trendline of its downward channel on Friday. The price has danced around the $1,733 Fibonacci level since May 14 and closed at $1,731 on Friday. I put out a sweet spot alert on Twitter Friday morning due to the rising buy Volume pattern that occurred in London on Thursday and Friday along with a healthy $40 price gain since pivoting off the Pennant on Wednesday.
Given current events, any technical studies on the daily chart that may not be in perfect alignment for a bullish move to $1,800 as we enter early summer, will be forced to do so in the very near-term. With that said, keep eyes on $1,750 and $1,765 for potential resistance before gold pushes onward.
Here are a few articles, charts, and an interview to peruse since my last gold analyses before closing up shop tonight:
-
Shanghai gold boss wants super-sovereign currency – Reuters, Apr. 28
-
“World money is coming” / transcript of IMF briefing – Jim Rickards, May 9
-
Egypt’s April gold reserves rise to record high on coronavirus worries – ZAWA, May 10
-
JPMorgan makes the case for gold under a number of scenarios – CNBC, May 11
-
Economists & Investors: What Post-Pandemic Future Looks Like – Bloomberg, May 12
-
ETF Gold Holdings Set Yet Another Record – Peter Schiff, May 13
-
FED’S POWELL: U.S. in the worst recession since WWII – SIA, May 13
-
Central banks will continue to buy gold, some more than usual – Mining Weekly, May 15
-
5 Reasons Gold Miners Have Massive Outperformance in the Tank – KLC, May 15
-
Hedge Fund Luminaries Are Lining Up Behind Gold Again – Bloomberg, May 17
-
FED’S POWELL: SPREAD OF VIRUS MOST IMPORTANT DATA FOR FED – May 17
-
Odey: Governments May Make Private Gold Ownership Illegal – Bloomberg, May 20
-
Heavy rush in jewelleries to buy gold amid lockdown – Mathrubhumi India, May 21
-
Central Banks Buying $2.4 Billion In Financial Assets Every Hour – CNBC, May 22
-
Gold record price by Jan, more demand than market can handle – MarketWatch, May 22
-
Tradition leads to buying at gold stores – Times of India, May 26
-
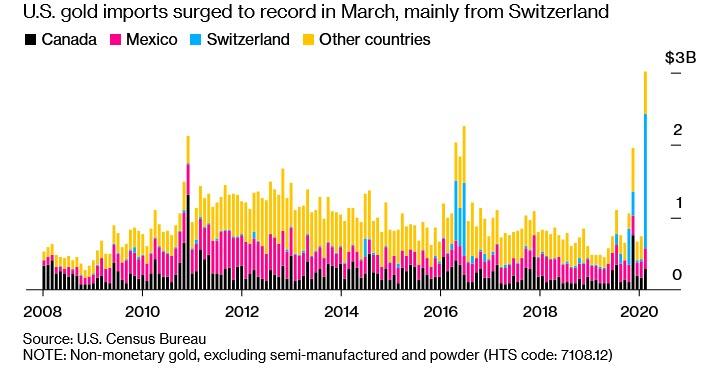
U.S. imports record gold from Switzerland as virus upends trade – Reuters, May 26
-
Exclusive: Bullion banks prepare CME pullback after virus snarl – Reuters, May 28
-
NY Fed Williams: U.S. is not ‘anywhere near’ its limits to run up debt – CNBC, May 28
-
Gold gains as uncertainty over Trump’s response to China spurs demand – CNBC, May 29
-
Virus Has Sparked Round-the-Clock Rush to Fill U.S. Gold Vaults – Bloomberg, May 29
-
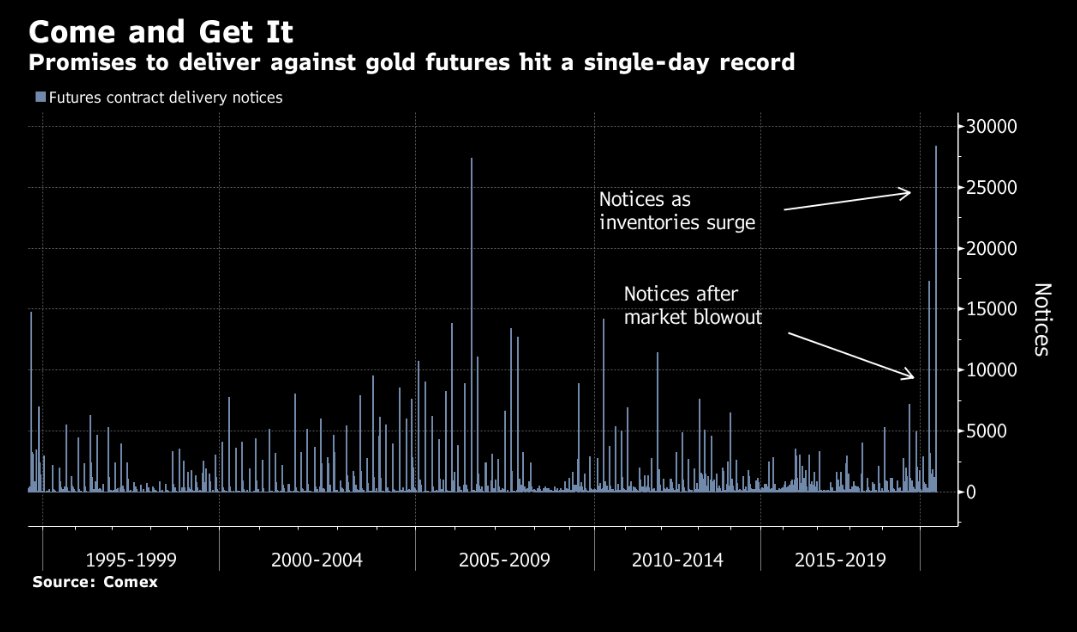
Promises to deliver hit single day record at the COMEX – Christophe Barraud, May 30
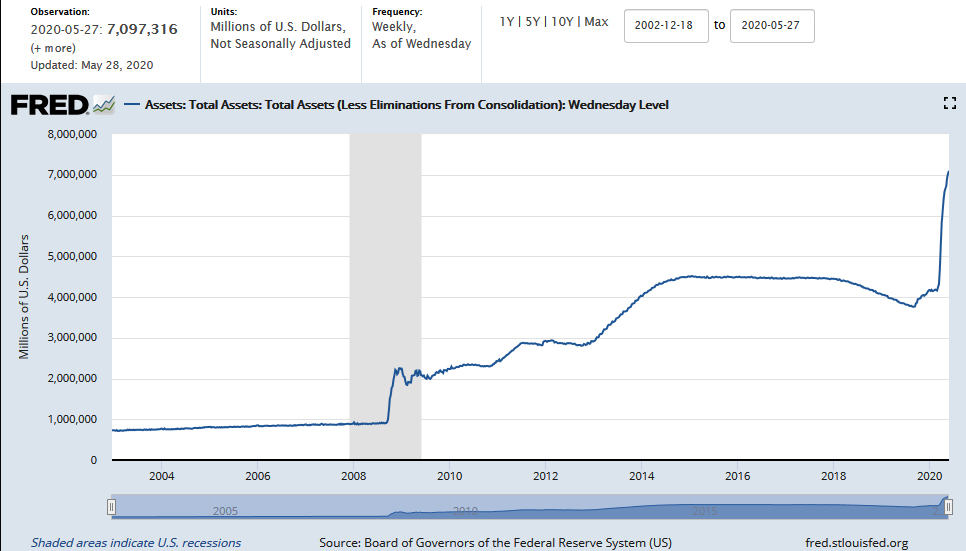
- FED TOTAL BALANCE SHEET SIZE RISES TO $7.1 TRILLION – FRED
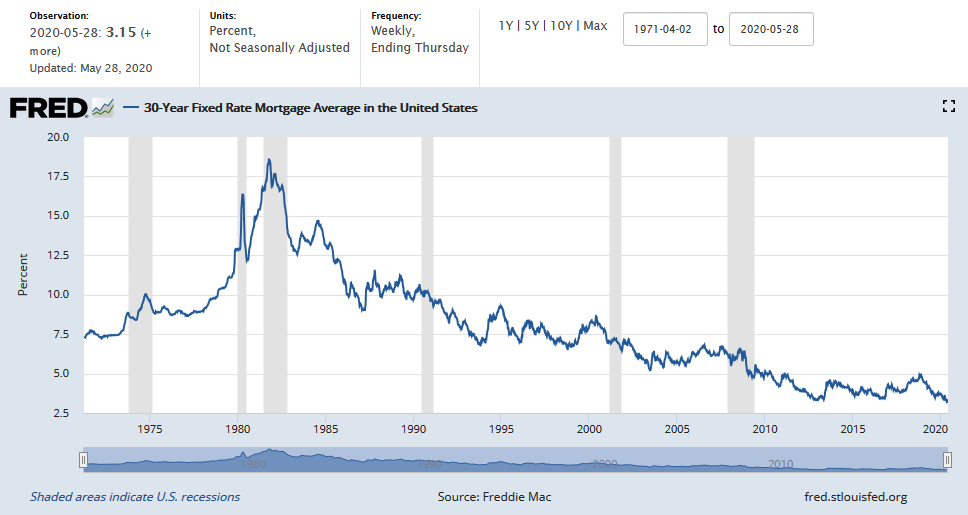
- 30-Year Fixed Rate Mortgage Average in the United States – FRED
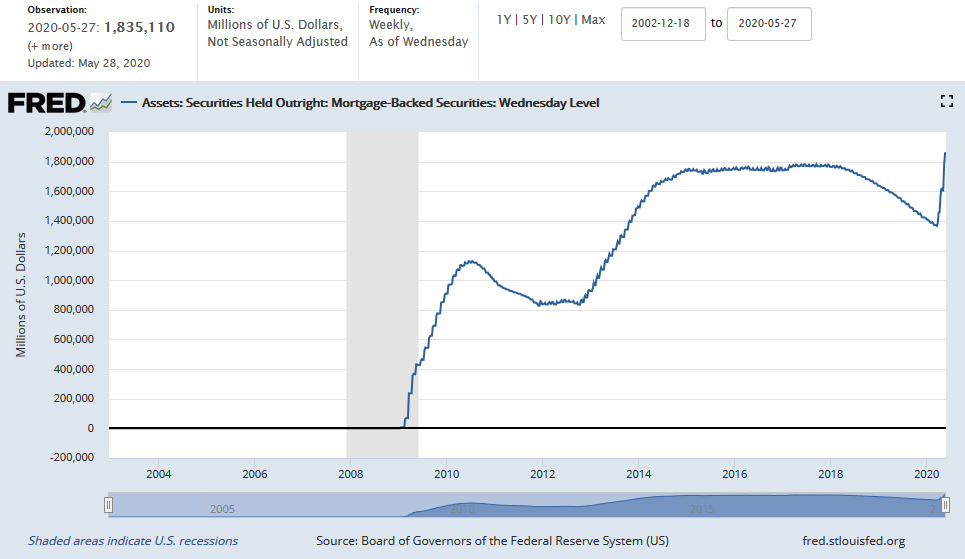
- Fed Purchases of Mortgage Backed Securities (MBS) – FRED
-
U.S. Debt Crisis as Fed Balance Sheet Explodes – Wall Street on Parade, May 29
-
The U.S. will be designating ANTIFA as a Terrorist Organization – POTUS, May 31
-
U.S. cities assess protest damage, await another day of unrest – AP, May 31
Monetary System’s Navigational Beacon w/Simon Mikhailovich – Gold or Crypto/Bitcoin – Real Vision, Oct. 2019
Plan Your Trade, Trade Your Plan
TraderStef on Twitter
Website: https://traderstef.com


4 thoughts on “Gold Chart Exclusive for Precious Hour Subscribers – Technical Analysis”
Comments are closed.