

A brief technical analysis update this evening on the recent price action of silver and gold as we enter the seasonal summer upside. If you missed my appearance on Operation Freedom live talk radio w/Dr. Dave Janda on Jun. 14, have a listen and review all of the charts. To view a larger version of any chart, right-click on it and choose your “view image” option.
Silver Spot monthly chart from the Jun. 14, 2020 interview…

Silver Spot weekly chart as of Jul. 21, 2020 at 9pm EST…

Excerpt from the Feb. 27, 2020 silver technical analysis:
“The $21.49 price point was important resistance in 2008, is where an exponential run to its 2011 peak found its legs, is the first Dead Cat Bounce resistance level during the 2013 price collapse, and is the resistance area where the price peaked in 2016 following the 2015 low. Building core positions in paper or physical metals is ideal while the price point remains low, and there are plenty of opportunities in the near-term to trade momo-play sweet spots.”
The long-awaited $21.49 Fibonacci level was taken out decisively today. The high print as of 9pm was $22.81. The daily chart (not shown) is in overbought condition. The weekly chart above is overbought on the StochRSI, just as the DMI-ADX is forming a bullish Alligator Tongue set-up. There is more room for upside in the near-term, but the price action is due for a breather with the $23 and $24.50 laterals quickly coming into view. Some consolidation and backfill with a retest of $21.49 as support would be constructive. The faster and higher a price runs, the harder it can fall with automated trading platforms and profit taking. The next levels of resistance beyond $24.50 are the 50% Fibonacci at $26.89 and 38.2% Fibonacci at $27.43. The big show has begun, so stay on your toes and take advantage of any dips.
Gold Spot weekly chart as of Jul. 21, 2020 at 9:30pm EST…
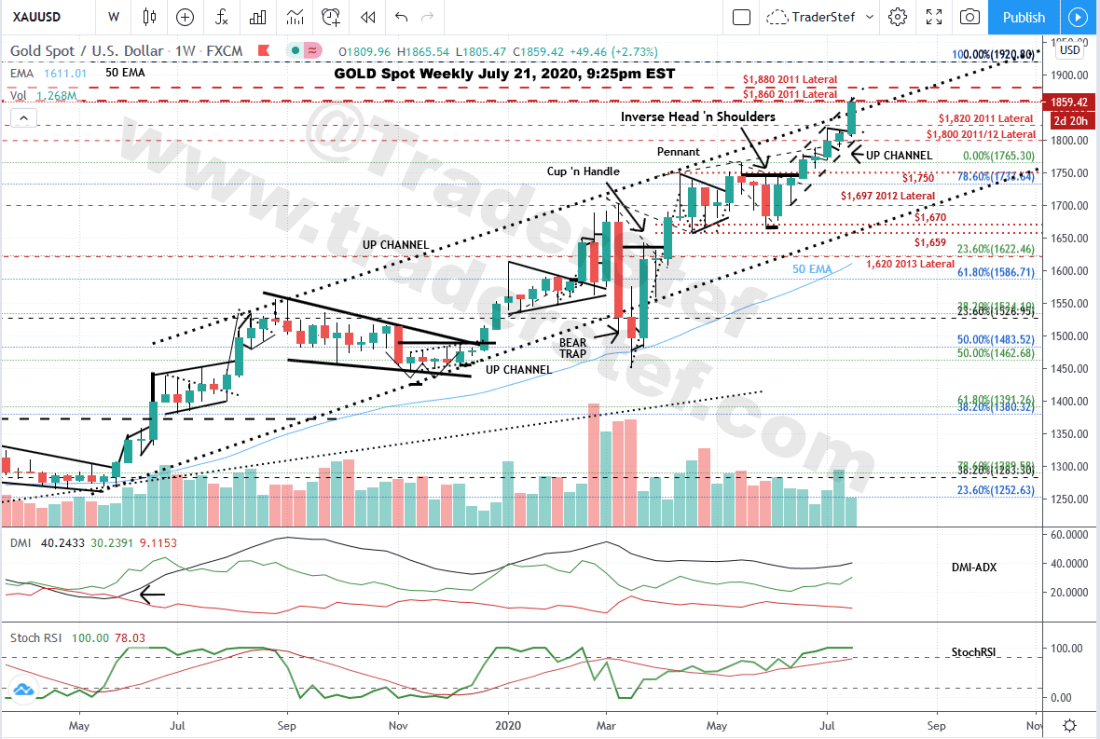
“Given current events, any technical studies on the daily chart that may not be in perfect alignment for a bullish move to $1,800 as we enter early summer, will be forced to do so in the very near-term. With that said, keep eyes on $1,750 and $1,765 for potential resistance before gold pushes onward.” – May 31, TraderStef
Excerpt from the Jun. 21, 2020 gold weekly chart (Twitter thread) analysis:
“The $1,750 overhead resistance is being challenged once again. After breaking out of the Pennant, then chopping out into a Descending Broadening Wedge, the price action has completed a bullish Inverse Head & Shoulders drawn back to May 21 and is threatening to break above its $1,750 neckline overnight. The DMI-ADX is not optimally set-up yet, but the StochRSI is bullish. Stay on your toes for a potential sweet spot move to the upside as spring seasonality chop & consolidation comes to a close.”
The high print as of 9:30pm this evening was $1,865. The daily chart (not shown) is in overbought condition. The weekly chart StochRSI is getting long in the tooth and the DMI-ADX has been in a bullish mode since the summer of 2019. There is more room for upside in the near-term, but the price action is due for a breather as the $1,860 & $1,880 lateral are just ahead. Just as with silver, some consolidation and backfill with a retest of support at $1,820 would be constructive. The next level beyond $1,880 is the $1,921 (Sep. 6, 2011 at $1,920.74 Spot) all time high, then blue sky is in view with additional analysis when we get there.
Follow real-time updates on today’s analyses at this Twitter thread.
Metallica – Enter Sandman Live in Moscow 1991
Plan Your Trade, Trade Your Plan
TraderStef on Twitter
Website: https://traderstef.com

NONE of the content produced by TraderStef, staff members, or any services associated with this website should be construed as financial or investment advice. Financial investment is a risky endeavor and may lead to substantial loss. Always perform due diligence before undertaking any financial decision. Not a Financial Advisor.
Copyrighted Material – A “by TraderStef” credit linked back to this website is required when using any quotes, written material, technical analysis charts, or publishing a full version of an article.


3 thoughts on “Gold & Silver Chart Exclusive for Precious Hour Subscribers – It’s Showtime!”
Comments are closed.