

A heads-up for a potential move to $1,800 or more this week.
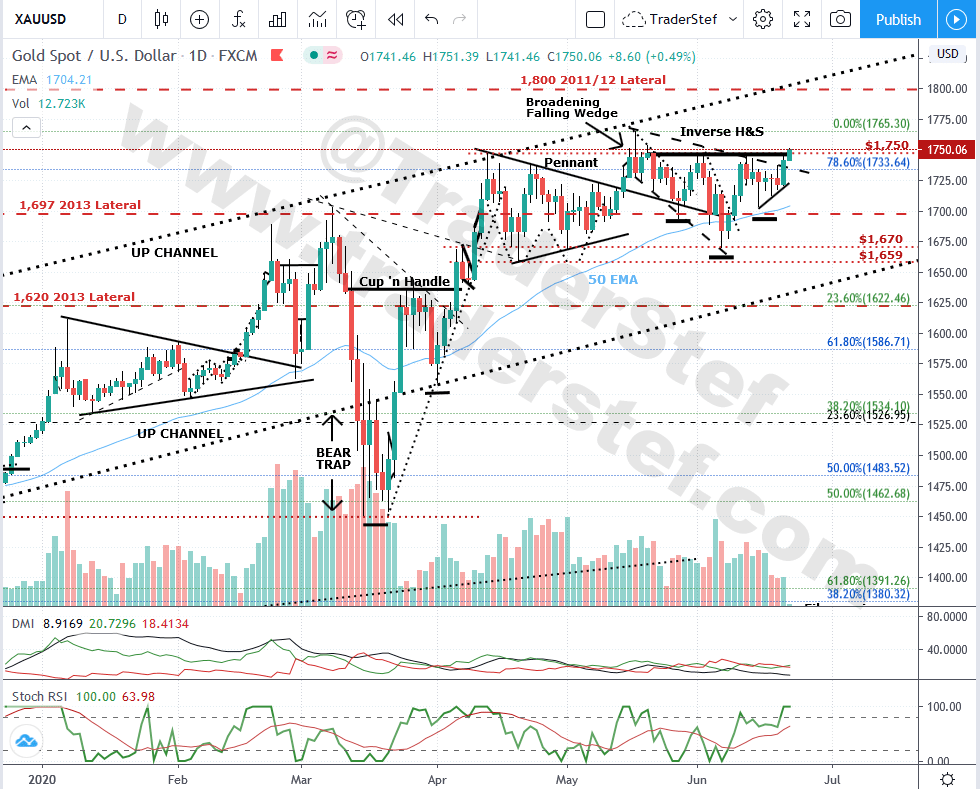
Gold Spot daily chart as of June 21, 2020 at 8:15pm EST…
To view a larger version of the chart, right-click on it and choose your “view image” option. If you missed my appearance on Operation Freedom live w/Dr. Dave Janda live talk radio on Jun. 14, go and listen to the interview and review the charts posted last week.
The $1,750 overhead resistance is being challenged once again. After breaking out of the Pennant, then chopping out into a Descending Broadening Wedge, the price action has completed a bullish Inverse Head & Shoulders drawn back to May 21 and is threatening to break above its $1,750 neckline overnight.
The DMI-ADX is not optimally set-up yet, but the StochRSI is bullish. Stay on your toes for a potential sweet spot move to the upside as spring seasonality chop & consolidation comes to a close.
Plan Your Trade, Trade Your Plan
TraderStef on Twitter
Website: https://traderstef.com


3 thoughts on “Gold Chart Exclusive for Precious Hour Subscribers”
Comments are closed.