
Originally published on Feb. 24, 2021 by TraderStef at CrushTheStreet
There is a lot to cover on the charts tonight, and without the background noise from news headlines or social media chatter. If you want perspective on how the gold and silver price action developed over the last two months, peruse my most recent analyses.
- The 2020 Gold and Silver Rally (Twitter thread) – Dec. 31, 2020
- A Robbin-da-Hood “Silver Squeeze” Requiem (Twitter thread) – Feb. 4, 2021
- TraderStef Interview on Live Radio w/Operation Freedom (Twitter thread) – Feb. 21
I am including TradingView daily charts that have additional details for reference and were used during the Feb. 21 interview, but tonight’s commentary will focus on the weekly charts. To view a larger version of any chart below, right-click on it and choose your “view image” option.
“West: Gold ETFs have been shedding physical on lower demand. Why? COMEX prices have been down – ‘gold trade is not working.’ Asia: Refinery premiums are up 33% on higher physical demand. Why? COMEX prices have been down – ‘gold is on sale.’” – Simon Mikhailovich

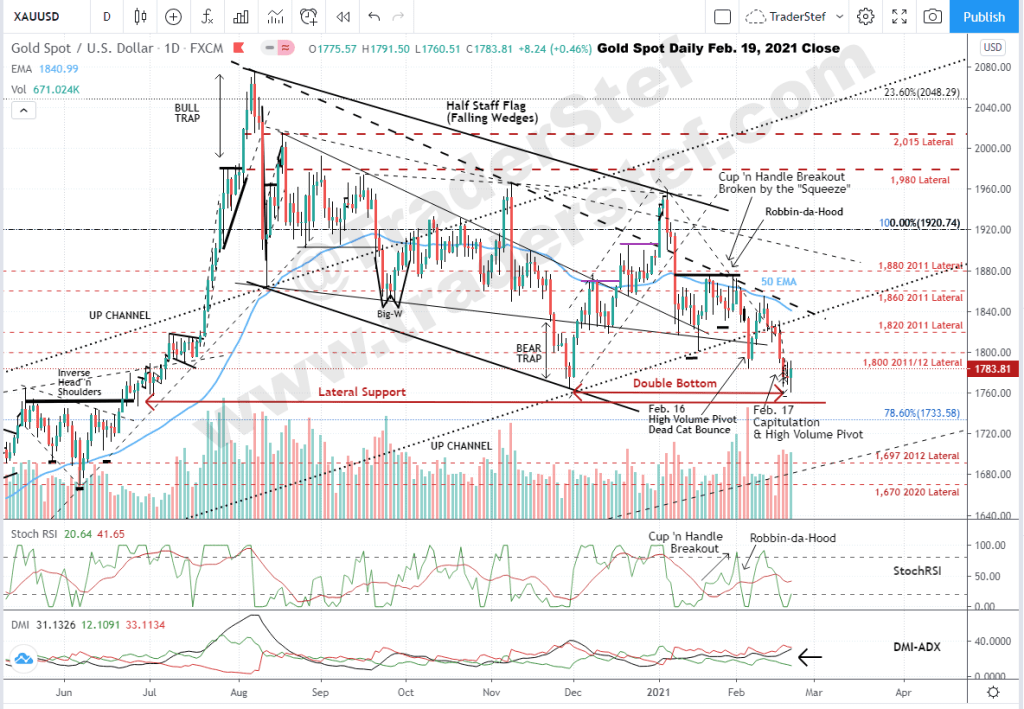
Gold Spot daily chart as of Feb. 19, 2021 close…
Gold Spot weekly chart as of Feb. 24, 5pm EST close…

Excerpt from the Dec. 31, 2020 weekly chart analysis:
“Volumes are steady across the board but a downtrend continues since the Aug. $2,074 high. As noted on Dec. 8, the chart is bullish and ripe for intraday scalps, with caution until $1,980 is taken out decisively.”
The dominant pattern that morphed out of a Falling Wedge is a Half Staff Flag and remains above a lower trendline drawn up from Jun. 2019, where a significant breakout above $1,380 occurred. The price action is bouncing around $1,800 this evening after printing an Adam & Adam Double Bottom last week at the $1,760/65 level. While viewing last week’s price action around the low on shorter timeframes, it appears to be a capitulation and has been volatile after the $52 upside pivot to $1,812.
The Double Bottom rests upon a convergence of the 50 Exponential Moving Average (EMA), an Inverse Head ‘n Shoulders neckline lateral where the 2020 summer breakout launched, and a Fibonacci confluence that increases resistance or support wherever they occur. The DMI-ADX setup is indicative of continued price chop until it reverses to a positive trend, the StochRSI has remained in oversold territory since September and is getting long in the tooth, the Money Flow, Momentum, and Commodity Channel Index (CCI) are all trending bullish, and a stable decline in Volume continues with the downside price trend since August.
Despite the extended consolidation and a downward hiccup after the Robbin-da-Hood paper silver-squeeze mob, gold remains in a bullish uptrend since the summer of 2019. To regain upside momentum, gold must make a near-term move out of the Flag with conviction and challenge $1,980 before the winter seasonal uptrend comes to a close. The Futures and Options at the CME are balancing their monthly books this week in gold and silver, and the price action going into March will be a bellwether of what to expect near-term. The gold chart is ripe for intraday scalps, with caution until $1,980 is taken out with decisive buy Volume.
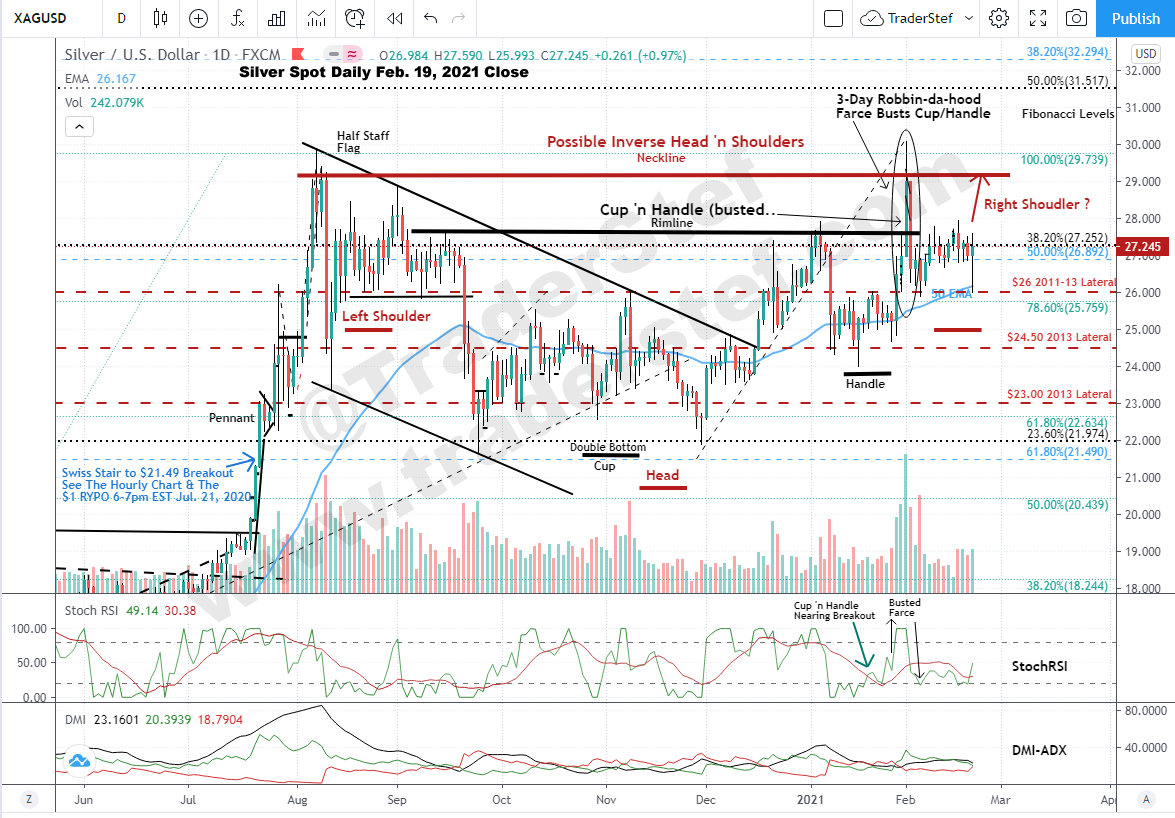
Silver Spot daily chart as of Feb. 19, 2021 close…
Silver Spot weekly chart as of Feb. 24, 5pm close…

Excerpt from the Dec. 31, 2020 weekly chart analysis:
“Trade cautiously until the topside Fibonacci confluence is taken out with conviction.”
Excerpt from the Feb. 4, 2021 Robbin-da-Hood analyses:
“The best opportunity to capture any substantial benefit occurred outside of U.S. trading hours, but GLOBEX access afforded large Futures players to game the foolish plan launched by a merry band of amateurs. The plan ruined the near-term technical picture and potentially delayed gains for everyone else, as a bullish fundamental and technical picture were nearing a breakout without the need for narcissistic gamers.”
Silver is finally back to consolidating between $27 and $28, which is where it was headed three weeks ago before the paper silver-squeeze mob blew up a bullish Cup ‘n Handle breakout opportunity and blunted gold’s upward momentum in the process. Silver is trading at $28 this evening and slightly above a Fibonacci confluence that has been a significant level of topside resistance since mid-August. The only positive that developed after a three-week delay is a potential Inverse Head ‘n Shoulders pattern that is in the process of completing a right shoulder, and the lateral neckline is just above $29 that intersects multiple candlestick wicks along its length.
An Up Channel has formed since the price pivoted off its recent low at $22. That pivot printed a Double Bottom slightly above the lower Fibonacci confluence, which provided support after the $21.49 breakout and the first low following August’s $30 high. All of the Moving Averages remain in bullish alignment under the price action, the DMI-ADX is nearing a positive Alligator Tongue setup, the StochRSI is in oversold territory and may remain there for an extended period, the Money Flow, Momentum, and CCI are flat, and the Volume is falling with a rising price which is indicative of weak momentum.
Overall, the silver chart is more bullish than gold on the weekly, but buying Volume needs to increase substantially for any breakout beyond $29 to have the momentum to carry it beyond $30 in the near-term. Silver is ripe for intraday scalps, with caution until $29 is taken out with decisive buy Volume.
Texas Hippie Coalition – Pissed Off and Mad About It
Plan Your Trade, Trade Your Plan
Website: TraderStef.com – and on Twitter & Gab
Headline Collage Art by TraderStef

NONE of the content produced by TraderStef™, staff members, or any services associated with this website should be construed as financial or investment advice. Financial investment is a risky endeavor and may lead to substantial loss. Always perform due diligence before undertaking any financial decision. Not a Financial Advisor.
Copyrighted Material – A “by TraderStef” credit linked back to this website is required when using any quotes, technical analysis charts, or publishing a partial version of an article.


2 thoughts on “Gold and Silver Squeeze Post-Mortem Technical Analysis”
Comments are closed.