

Originally published on Mar. 11, 2021 by TraderStef at CrushTheStreet
I received numerous requests to provide a technical analysis update on gold and silver, as the price action attempts to break away from the downside consolidation since August. They are nowhere near out of the woods despite a few positive signals since March 8. Before addressing the charts, there are a couple relevant points to mention about what is and is not influencing the recent price momentum.
Ever since Biden took over the White House, the domestic picture in the U.S. is not pretty. There is also a fear of inflation that arose in the alternative media and mainstream news headlines, but is not having a direct influence on gold or silver at this time with real interest rates in negative territory. If the U.S. consumer suddenly decides to unload all of their savings and go on an unprecedented spending spree, which is highly unlikely, then the Velocity of Money might have a chance to recover from its freefall collapse and foretell that a significant boost in inflation is on the horizon. In the meantime, we are deep into deflation land.
Velocity of Money vs. $USD Dollar Purchasing Power…

Gold vs.US 10-year Real Yields (inverted)…

The interest rate on 10-year Treasuries has risen a little bit and attracted a rehash of fear that bond vigilantes have taken control. I don’t see that scenario, yet.
- Janet Yellen and the Return of the Bond Vigilantes – The National Interest
“34yrs of screaming every time the topside trendline(s) are tapped, and we’re not even close yet this time around. It’s still a bull market. If rates take out 3%, the USA financial system ends.” – @TraderStef, Mar. 9
10 Year Treasury Note Yield, monthly chart as of Mar. 11, 2021…

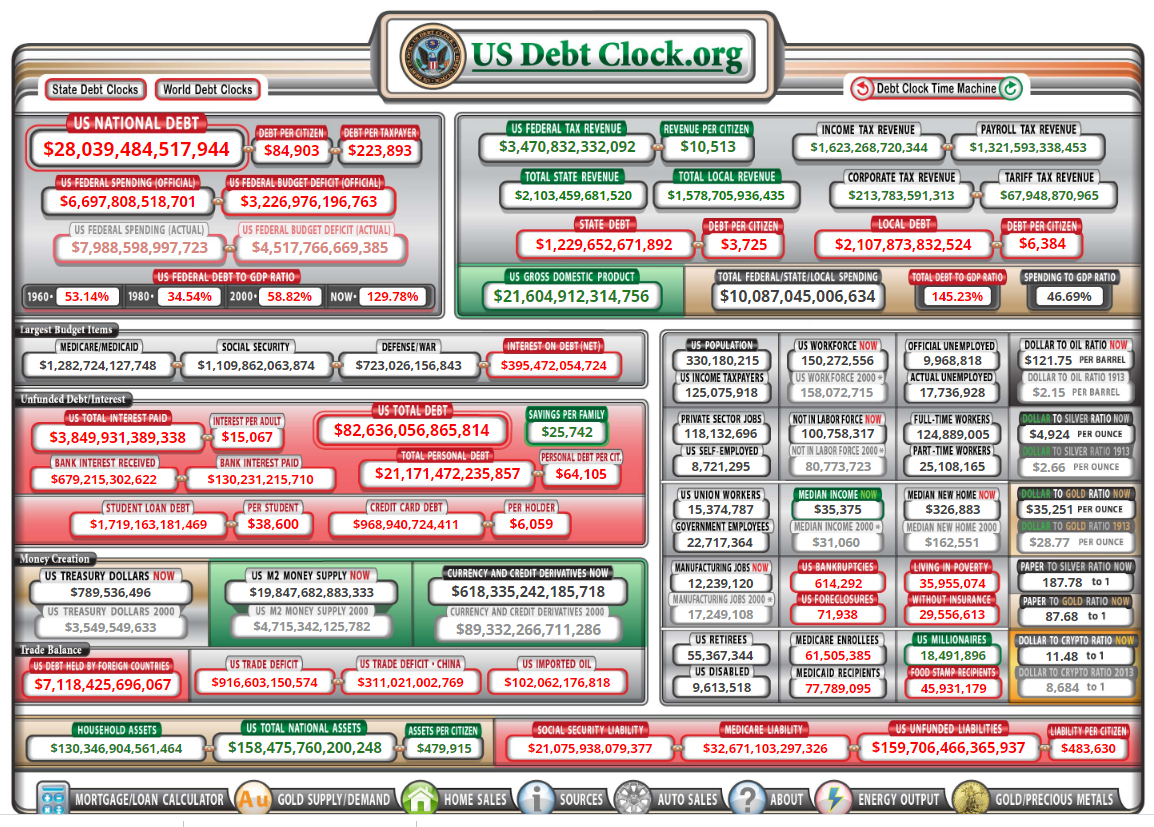
The recent sell-off in the bond market (rising yields) shows the limits of Modern Monetary Theory (MMT). MMT assumes that the U.S. government does not have to rely on taxes or sovereign debt issuance for spending, as it can print as much as it needs. It also assumes that a government budget is not the same as your household budget and should not be shaped by fears of a rising national debt clock. The U.S. national debt is officially at 28 trillion this evening, and Biden signed another pandemic related spending bill today with a 1.9 trillion price tag.
- Biden Signed $1.9 trillion Covid Bill: Cost $17,000 Per Person – Washington Examiner
U.S. Budget Deficit Since 1914…

The bottom line is the U.S. is running enormous deficits and sovereign debt yields were rising temporarily. As the Fed tries to push yields back down, the dollar falls and gold rises. The real truth about MMT is we can spend and keep interest rates in check for a while, but we cannot prevent dollar debasement. The national debt in 1980 was $907 billion vs. 30 trillion in 2021 when we include the American Rescue Plan (aka Covid Relief Bill) signed into law by Biden today.
Senator Kennedy Talks Covid Pork – “Americans Aren’t Morons”…
Who Will Thrive in the Coming Deflation?… “It is hard to overstate the degree to which psychology drives an economy’s shift to deflation. When the prevailing economic mood in a nation changes from optimism to pessimism, participants change. Creditors, debtors, investors, producers, and consumers all change their primary orientation from expansion to conservation. Creditors become more conservative, and slow their lending. Potential debtors become more conservative, and borrow less or not at all… As investors become more conservative, they commit less money to debt investments. Producers become more conservative and reduce expansion plans. Likewise, consumers become more conservative, and save more and spend less… These behaviors reduce the velocity of money, which puts downward pressure on prices. Money velocity has already been slowing for years, a classic warning sign that deflation is impending. Now, thanks to the virus-related lockdowns, money velocity has begun to collapse. As widespread pessimism takes hold, expect it to fall even further.” – Treasury & Risk, Apr. 2020
Fed Wants Inflation But Their Actions Are Deflationary… “The Liquidity Trap: When injections of cash into the private banking system by a central bank fail to lower interest rates or stimulate economic growth. A liquidity trap occurs when people hoard cash because they expect an adverse event such as deflation, insufficient aggregate demand, or war… Signature characteristics of a liquidity trap are short-term interest rates remain near zero. Furthermore, fluctuations in the monetary base fail to translate into fluctuations in general price levels.” – Real Investment Advice, Aug. 2020
ECB Pledges ‘Significant’ Increase in Bond Purchases; U.S. Yields Fall… “’Purchases under the PEPP over the next quarter to be conducted at a significantly higher pace than during the first months of this year.’ The move for further ECB support, which includes myriad liquidity boosts for the region’s banking sector and record low interest rates of near zero percent, should provide further downward pressure for bond yields in Europe and, by extension, the United States.” – TheStreet, Mar. 2021
Let’s move onto a brief overview of the gold and silver charts, and my recent analyses since Dec. 31 are linked below. To view a larger version of any chart, right-click on it and choose your “view image” option.
- The 2020 Gold and Silver Rally (Twitter thread) – Dec. 31, 2020
- A Robbin-da-Hood “Silver Squeeze” Requiem (Twitter thread) – Feb. 4, 2021
- TraderStef Interview on Live Radio w/Operation Freedom (Twitter thread) – Feb. 21
- Gold and Silver Squeeze Post-Mortem Technical Analysis (Twitter thread)– Feb. 24
Gold Spot weekly chart as of Feb. 24, 5pm EST close…

Gold Spot hourly chart as of Mar. 11, 2021 7:15pm EST…

Excerpt from the Feb. 24, 2021 weekly chart analysis:
“The Futures and Options at the CME are balancing their monthly books this week in gold and silver, and the price action going into March will be a bellwether of what to expect near-term. The gold chart is ripe for intraday scalps, with caution until $1,980 is taken out with decisive buy Volume.”
Gold fell into a capitulation trap following the CME Futures and Options expiration during the last two business days of February. The price plunged below $1,750 on momentum and formed a Falling Wedge until a $1,676 low printed on Mar. 8. Finally, on Mar. 9 during the London and U.S. COMEX open, a wave of rising buy volume decisively pushed the price back above the 50 Exponential Moving Average (EMA) and the Falling Wedge on the hourly chart. I made note of that move on my Twitter feed, as it was the first time in many weeks that London and the CME were buying the metals in sync.
“Gold remains in a capitulation zone. The insane overnight NIRP in REPO, and Powell Fed Speak today may cause a knee jerk reaction across all markets. Stay on your toes.” – @TraderStef, Mar. 4
“Note: this morning is the first time in many weeks, that gold was bought on steady volume in both London & U.S. COMEX while breaching the 50 EMA to the upside on the hourly chart. Scalp opportunity brewing in the least, caution remains for swings or layering core positions .” – @TraderStef, Mar. 9
The pivot point was significant because it occurred at the lower trendline drawn up from the Jun. 2019 and Mar. 2020 low. An Inverse Head ‘n Shoulders pattern developed and the price printed a high of $1,740 this morning after breaching its neckline. The price is currently testing that neckline as support around $1,720 and riding the 50 EMA. The StochRSI is oversold and threatening to turn positive, but a poor DMI-ADX set-up and weak Volume are not cooperating this evening. The price may weaken a bit more or simply chop sideways until buying returns.
If $1,740 is taken out with conviction, the next challenge is the trendline drawn down from Jan. 5, then $1,750, $1,800, and $1,820 are the next bus stops. The chart is not very bullish, but is making some progress with a lot of technical damage to work through. Gold is in a window where upside winter seasonality comes to an end and does not return until early summer. The past year has been a crap shoot for seasonality price movement with only a 50% match, so at this point anything is possible.
Gold is in the same trading predicament as last month. The chart is ripe for intraday scalps, with caution until $1,980 is taken out.
Silver Spot weekly chart as of Feb. 24, 5pm close…

Silver Spot hourly chart as of Mar. 11, 2021 7:30pm EST…

Excerpt from the Feb. 24, 2021 weekly chart analyses:
“Overall, the silver chart is more bullish than gold on the weekly, but buy Volume needs to increase substantially for any breakout beyond $29 to have the momentum to carry it beyond $30 in the near-term. Silver is ripe for intraday scalps, with caution until $29 is taken out with decisive buy Volume.”
The silver price tumbled in lockstep with gold since the end of February. On the bright side, it printed a third higher low since Sep. 2020, which was $25.10 on Mar. 5, whereas gold printed a lower low since its Aug. 2020 high. After pivoting on the hourly chart, silver took out the overhead 50 EMA, then formed a Big W pattern with a brief Throwback to the 50 EMA, and that formed a Cup ‘n Handle with a rim line at $26. The price printed a high of $26.44 this morning, and is retesting support this evening at the confluence of $26 and the lower trendline drawn up from the Big W low.
The StochRSI and DMI-ADX are not positive and the overall Volume has trended downward since the Big W low. The bigger question is whether the price action will return to $29 in the near-term sooner than later, and that would complete the Right Shoulder of a potential Inverse Head ‘n Shoulders with a neckline at $30. Silver is ripe for intraday scalps, with caution until $29 is taken out with decisive buy Volume.
Colt Clark and the Quarantine Kids play “Bad Moon Rising”
Plan Your Trade, Trade Your Plan
Website: TraderStef.com – and on Twitter & Gab
Headline Collage Art by TraderStef

NONE of the content produced by TraderStef™, staff members, or any services associated with this website should be construed as financial or investment advice. Financial investment is a risky endeavor and may lead to substantial loss. Always perform due diligence before undertaking any financial decision. Not a Financial Advisor. Copyrighted Material – A “by TraderStef” credit linked back to this website is required when using any quotes, technical analysis charts, or publishing a partial version of an article.


One thought on “Gold and Silver Rise in a Disastrous Domestic Situation”
Comments are closed.